You only need 5 viewers to know if your Reel works. Here is why.
Jakob Nielsen's famous five-user rule, applied to short video, and what changes when you do.
Why I wrote this
When I describe Jeena to people who have run quantitative surveys before, the first question is usually some version of "but is five viewers really enough." They have been trained to think in statistical significance, and five sounds laughably small.
It sounds small because for the kind of question they used to ask (does this purchase intent number differ from baseline by 2 percent at p less than 0.05) it would be. But content testing is a different kind of question. You are not measuring a small effect size. You are looking for recurring failure modes, and recurring failure modes show up almost instantly.
So this is the short version of why I built Jeena around small panels of real viewers, not large quantitative surveys. The basis is a rule Jakob Nielsen wrote up in 2000, and it has held up across every adjacent discipline that has tested it since.
Where the rule comes from
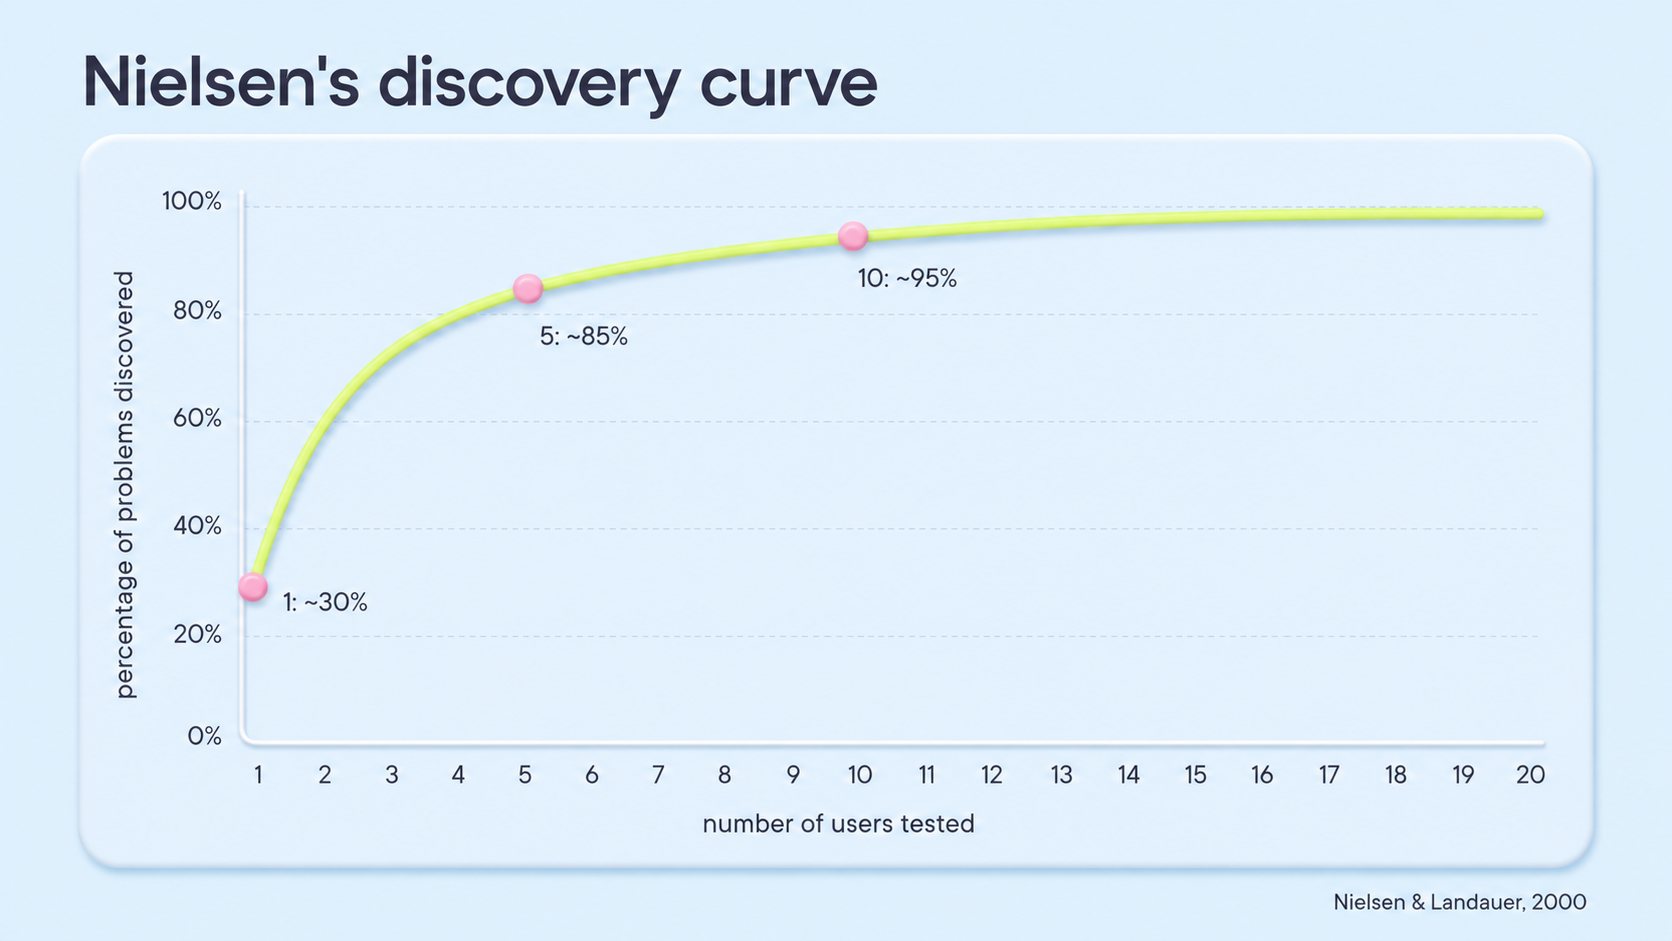
In 2000, Jakob Nielsen and Tom Landauer modelled how usability problems get discovered as you add testers. Their finding: with one user, you catch about 30 percent of the usability problems on a site. With five users, you catch about 85 percent. With ten, about 95 percent. The curve flattens fast. Past about 15 users, you are mostly rediscovering the same problems the first few already told you about.
The reason is that the failures stack. If a button is in the wrong place, the first user struggles with it. So does the second. So does the third. By the fifth user, the failure mode is unambiguous. Testing a sixth user mostly confirms what you already know rather than telling you something new.
Why the curve looks the same for short video
Attention failures recur, the same way usability failures do
If your hook is leaking attention to the chair behind you, viewer one looks at the chair, viewer two looks at the chair, viewer three looks at the chair. By viewer five, the failure mode is unambiguous. The fix is to move the chair. Testing twenty viewers tells you the chair is still a problem, which you already knew at viewer five.
Perception failures recur too
If the message of your video does not land, the impressions survey shows it in the first few viewers. The perception summary gives you the descriptors viewers reached for in their own words; five descriptors that land somewhere other than the message you set out to send are enough to know it is not landing. Fifty viewers add precision, not insight.
Emotional-reaction failures are the easiest to spot in small n
A wow-moment, the eyebrow raise that surfaces it, either happens or does not. Five viewers either reacted at the beat you intended, or none of them did. The signal is binary at small n. Quantitative surveys try to recover this signal indirectly by asking "did you find this engaging" on a Likert scale, which is exactly the kind of self-report that gets distorted by the asking.
With five viewers you catch about 85 percent of attention failures. With fifty you mostly confirm what the first five already told you.
When the small-n test stops working
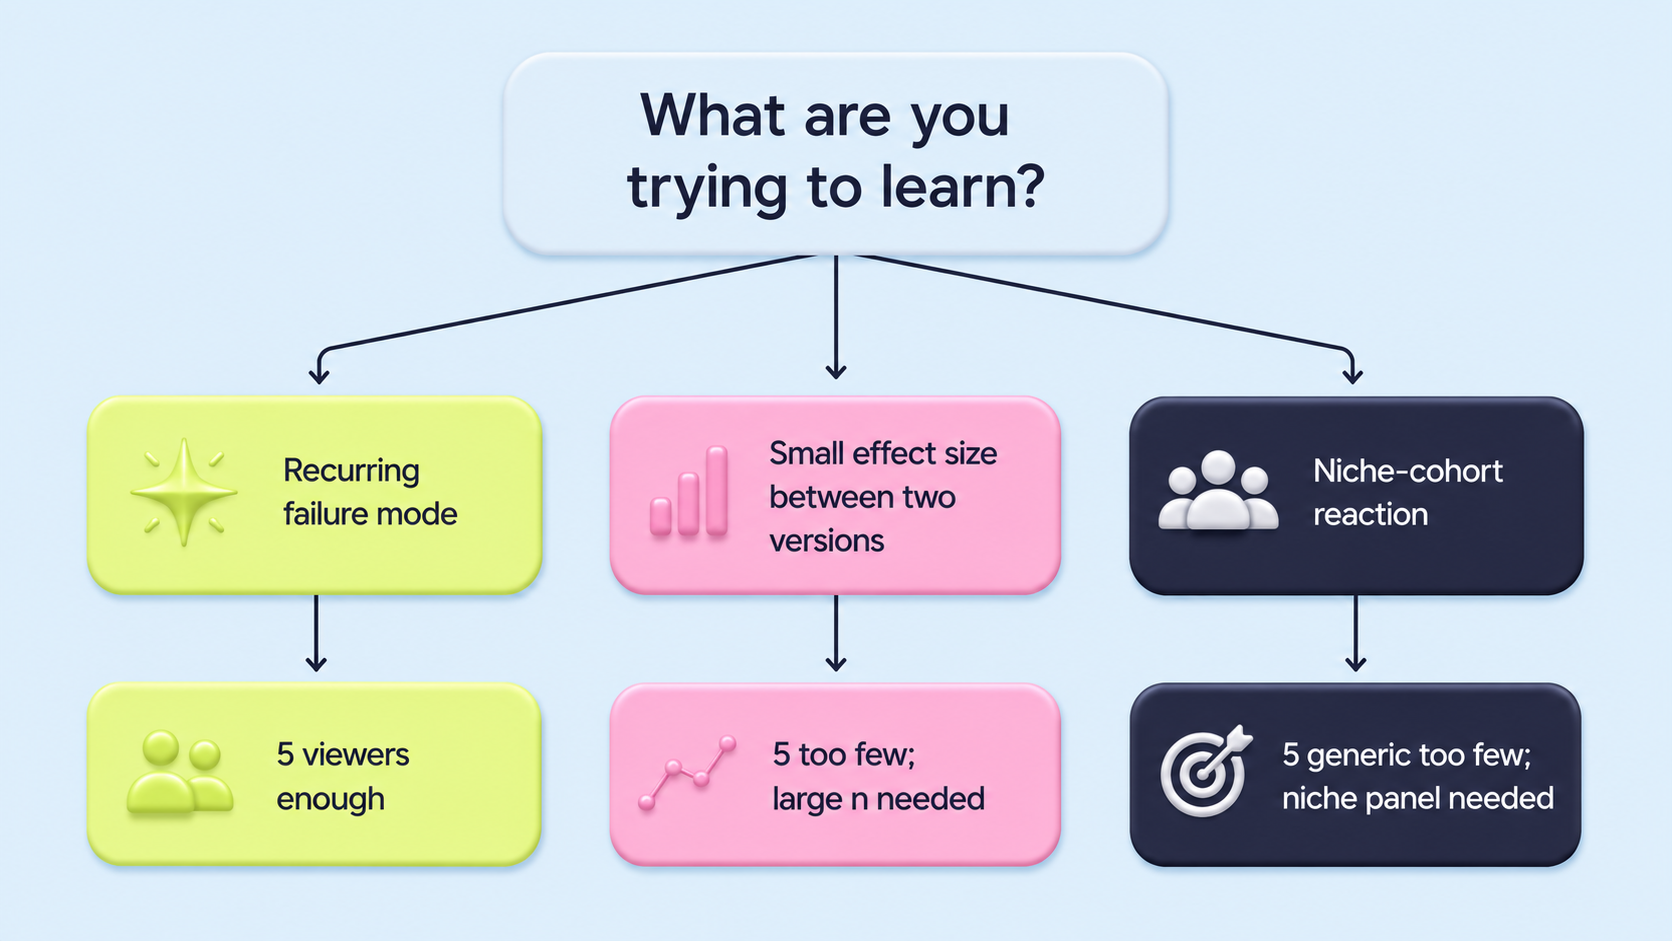
The rule applies when you are looking for recurring failure modes. It does not apply when you are estimating a small effect size, or when your video targets a specific niche cohort whose reaction will not show up in a generic five-viewer panel.
If you are choosing between two thumbnails and the expected difference is 3 percent, five viewers cannot help you. If you are testing whether a creative landed for senior dermatologists specifically, five generic viewers cannot tell you. The rule is a tool for catching the big stuff, fast. It is not a substitute for a large quantitative test when you actually need one.
How this looks inside a Jeena report
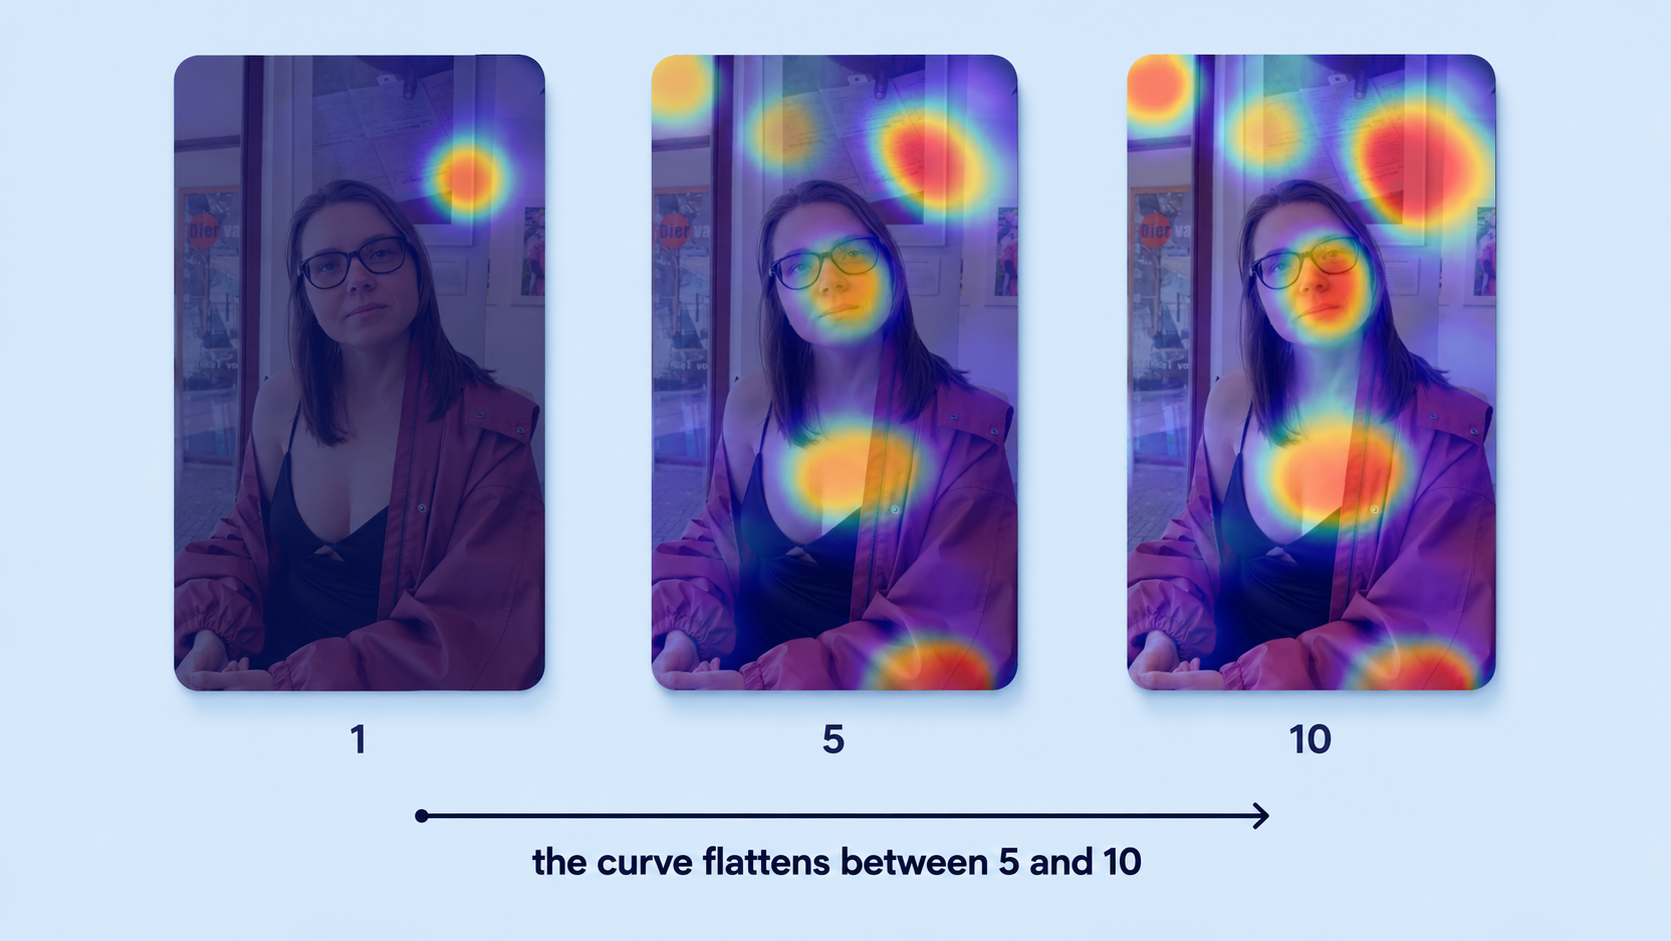
A Jeena report does not show you per-viewer rows. What you see is the aggregated heatmap: one combined view of where 5 to 10 real people actually looked, with hot zones where their gaze landed at the same time. The Nielsen mechanic does its work underneath that single visualization, not as separate rows for you to scroll through.
- What you actually seeOne aggregated heatmap per scene, not per-viewer rows. Plus a wow-moments timeline, a perception summary, and three AI recommendations on what to change. The Nielsen mechanic happens beneath that single view.
- How a recurring failure becomes visibleA failure shows up as a consistent hot zone where you did not want one. If most viewers in the panel land their gaze on the same wrong spot (the chair behind the speaker, the logo in the corner), the aggregated heatmap lights up there — even though no single viewer "voted."
- Why the Basic panel goes up to 10, not just 5Five is enough to make a recurring hot zone visible (~85 percent of failure modes per Nielsen). Ten lifts coverage to ~95 percent by catching long-tail failures the first 5 might miss, and it rules out the case where one outlier dominated a tight panel. Past 10 is diminishing returns for content-decision questions.
Niche cohorts: recruit, do not inflate
If the question is about a niche audience (only senior dermatologists, only Android users, only your existing customers), the right move is to recruit specifically rather than to inflate the panel. The five-viewer rule applies inside the niche too. Five from your target audience tell you more than fifty from a generic panel.
If you have already lined those people up, you can run them through Jeena for free as a Private Audit. You share a code with your hand-picked audience and they watch privately on their own phones. The Basic-tier mechanics (aggregated heatmap, wow-moments chart, perception summary) work the same way, but the panel is the one you brought.
What this looks like in the data
Imagine a video that opens with a wide shot of a workspace, a stat on screen, then the founder cuts in at second 3. After the panel runs, the aggregated heatmap shows a hot zone on the chair behind the speaker, not on the stat. That single visualization is the recurring failure: enough viewers landed their gaze on the chair that it lit up the heatmap, even though no single row of data shows that.
The fix list is one item: move the chair or reframe the shot. Running 50 viewers would not change the conclusion; it would just deepen the same red zone on the same chair.
What this means if you have been delaying the test
A common pattern I see: a creator records a video, knows it might not be working, and tells themselves they will run a real test "when they have more budget." Or never, since the lab-based tests they have in mind are only available to corporations. The implied logic is that a small test will not give them enough signal to act on.
In practice, five viewers from a generic panel will surface the obvious failure modes (the hook is not landing, the gaze is wandering off-screen, the descriptors viewers reach for in the survey land somewhere other than the message you intended) within two days and for the cost of a couple of coffees. The actionable fixes from those five viewers are usually the same fixes you would have got from fifty. The marginal value of the next 45 is small, and the time cost of waiting until you can afford 50 is large.
The rule is not "five is enough for everything." It is "five is enough to find the big problems, and the big problems are almost always what is holding the video back." The fix list from a five-viewer test is the high-leverage list. Run it before you spend the budget for fifty.
Run a five-viewer test in a couple of days
Upload your video to Jeena. A small panel of real viewers watches it on their phones with the front camera on, and you get the attention heatmap, the visibility map, the wow-moments chart, and a summary of how viewers perceived the video. The five-viewer test surfaces the recurring failure modes the same way Nielsen showed for websites. You do not need fifty to know what is breaking.
No "schedule a call." No sales rep. Upload, get your report in a couple of days, act on the high-leverage fixes.
Frequently asked
Is Jakob Nielsen's five-user rule actually applicable to video, or only to website usability?+
The underlying mechanic (recurring failure modes get discovered fast and the discovery curve flattens) holds for video the same way it holds for usability. If five viewers all leak gaze at the same on-screen element, the failure mode is unambiguous. Adding a sixth viewer mostly confirms. The rule was built for usability problems, but the rule is really about how failure-mode discovery scales, which is the same shape for content as it is for products.
Why not just run a 50-viewer or 100-viewer test if I want precision?+
Large tests are better at estimating effect sizes (does version A score 3 percent higher than version B). They are not better at finding the big creative problems, because the big creative problems show up in the first few viewers and the rest just confirm. For most content decisions, the high-value question is "what is broken in this video," not "what is the precise lift of version A over version B." Five viewers answer the first question well. They cannot answer the second.
When does the small-n test stop working?+
Three cases. When you are estimating a small effect size and need statistical precision, five is too few. When your video targets a narrow niche audience and five generic viewers will not represent them, you need a niche-recruited panel of any size. And when the question is about post-watch behaviour at scale (purchase rate, follow rate), the test is the wrong tool entirely, because behaviour at scale lives downstream of attention and impressions and is better measured in the live feed.
What is Jeena?+
Jeena is a neuromarketing platform for short-form video. Real people watch your video on their phone with the front camera on. Jeena captures their gaze direction, blink rate, eyebrow raises, and their impressions of the video in a short survey afterward. You receive an AI-powered report with an attention heatmap, a visibility map, a wow-moments chart, a summary of how viewers perceived the video, and three specific recommendations for making the video work harder.
How does Jeena measure viewer attention?+
Jeena uses smartphone front-camera gaze tracking. Each engager calibrates once, then watches your video. The platform records where their gaze lands frame by frame, flags moments of surprise from facial expression, and combines that with a short impressions survey afterward. The result is a per-second timeline of what real viewers actually looked at and felt, plus a summary of how they perceived the video overall.
How much does it cost to test a video on Jeena?+
A typical test costs around ten euros. See the pricing page for current rates.