Blog
Cases, comparisons, guides, and studies on what makes short-form video work, written from real Jeena data.
Comparisons10
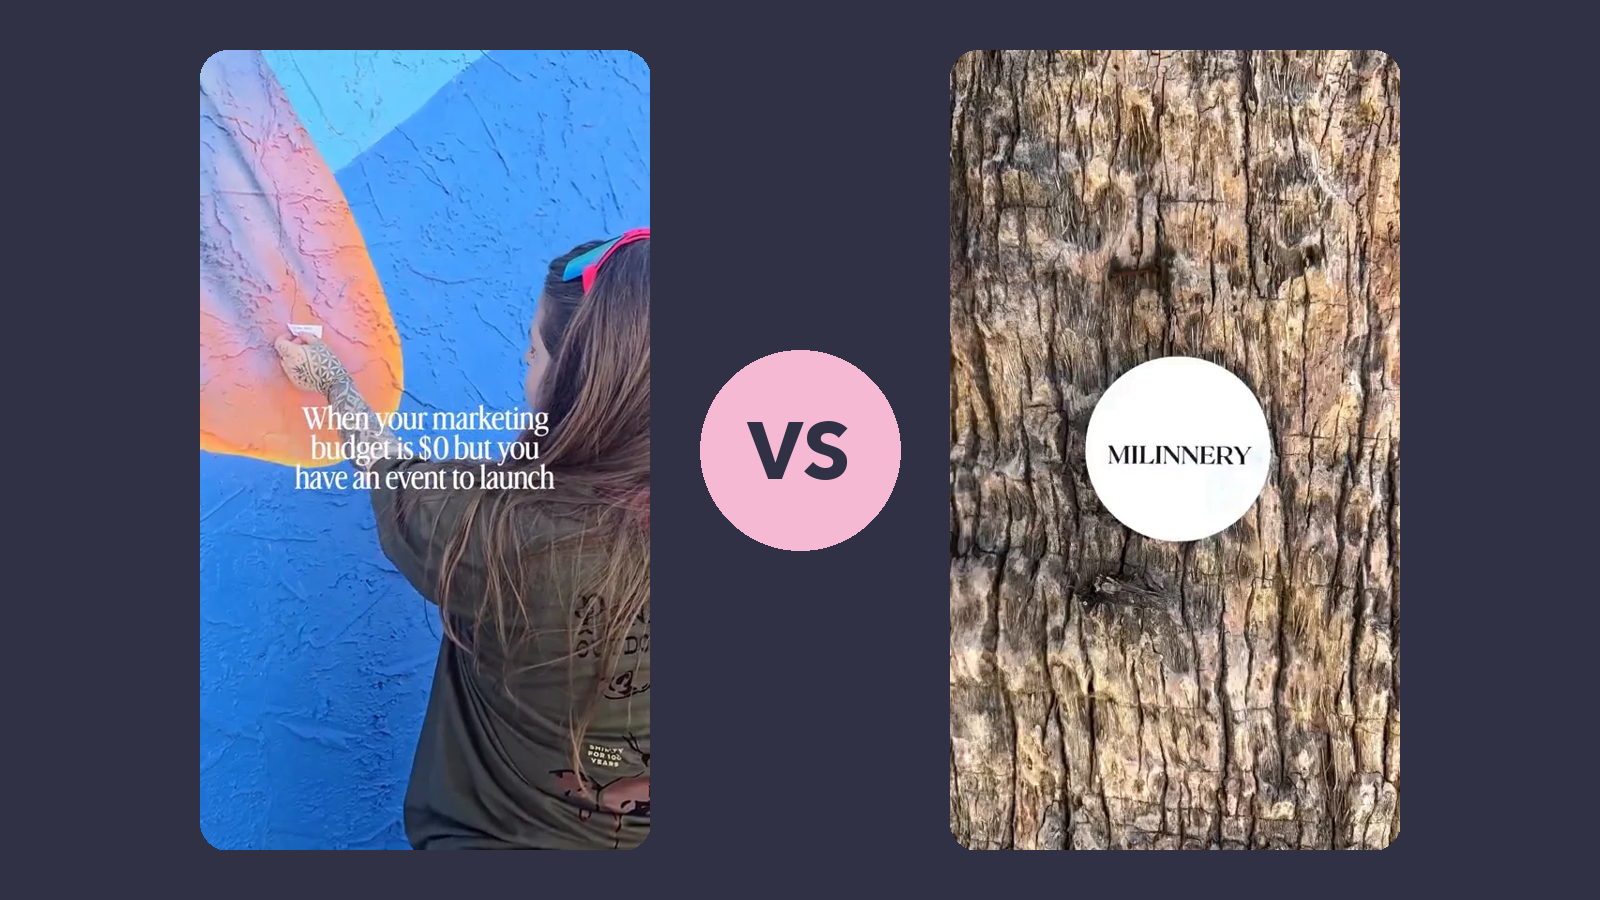
Two €0-budget videos tested almost the same. One got 2.7M views, the other 5,444.
Two creators ran the identical zero-budget play: stick a small thing on a series of street surfaces under a "marketing budget: €0" hook. Jeena came back near-identical on both, close survey scores (4.2 vs 3.7) and a small strongest reaction on each. In the wild one got 2.7 million views and the other 5,444. This is a study of a gap the eye-tracking could not see, and the one thing that most likely caused it.
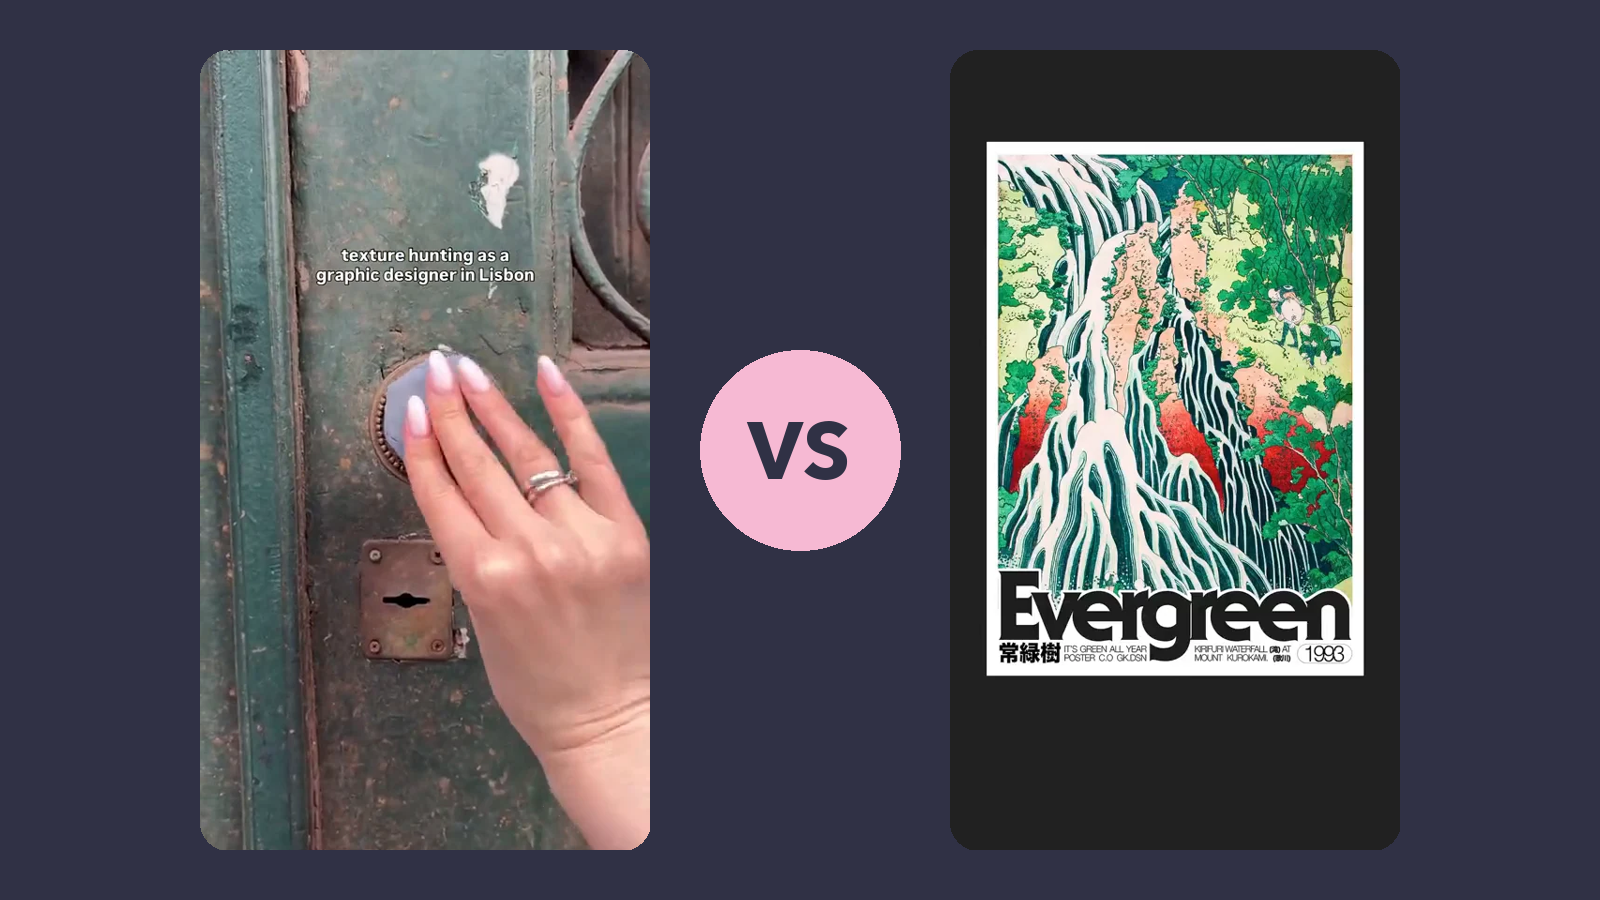
She pressed clay onto an old door. It got 51.6M views. His polished portfolio got 10,700.
One graphic designer presses clay onto the ornate hardware of a weathered door, lifts off its relief, inks it, and stamps the pattern into her sketchbook. Another is a guy showing his finished poster designs on a laptop. The polished one looked like the winner. It got a tiny fraction of the reach. One number explains it: the hands-on video hit a wow peak of 1.0. The portfolio stopped at 0.3.
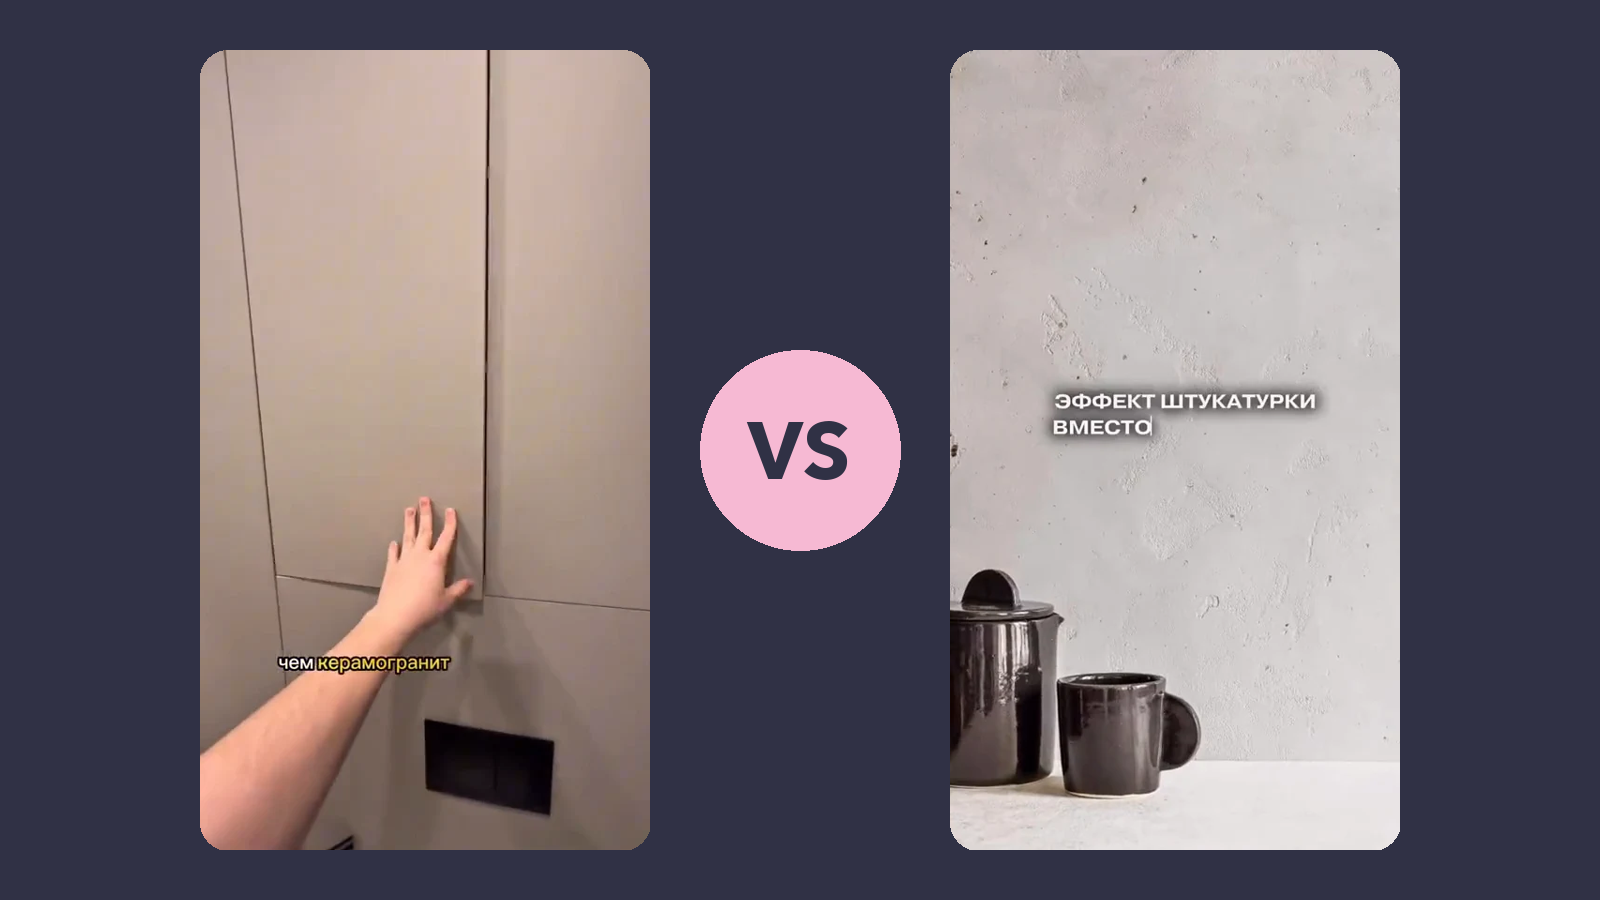
The polished home design video got 40 likes. The plain one got 25,600.
A bathroom renovation reveal with one concrete money-saving tip got ×640 the likes of a polished aspirational montage. In the lab the two came back close to a tie, with only survey sentiment leaning faintly toward the practical one. Here is what that near-tie can and cannot tell you about a 640x result.
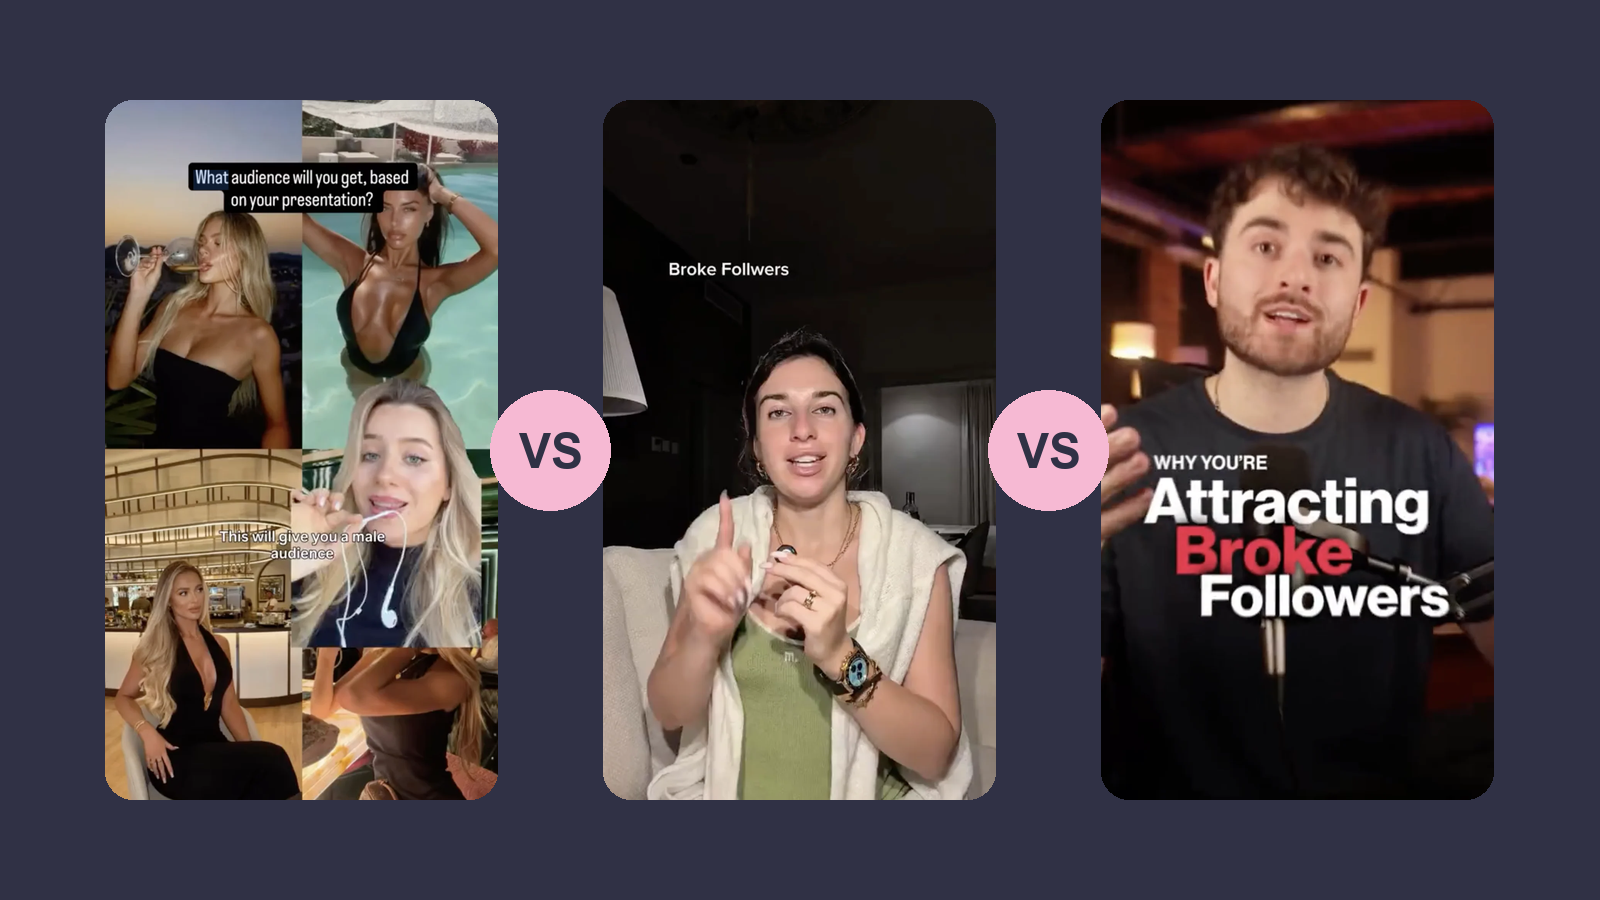
Three creators made the same video about broke followers. The vibes leaked, the proof held.
Three creators covered the same trending idea, why you attract "broke followers" and how to reach an audience that buys, in three formats spanning 735K to 9.4K views. Eye tracking across all three found the same split: the aspirational decor (luxury collages, the lived-in set, a city skyline) leaked gaze during the key claims, while the concrete proof (example accounts, a product demo) was each video's strongest hold.
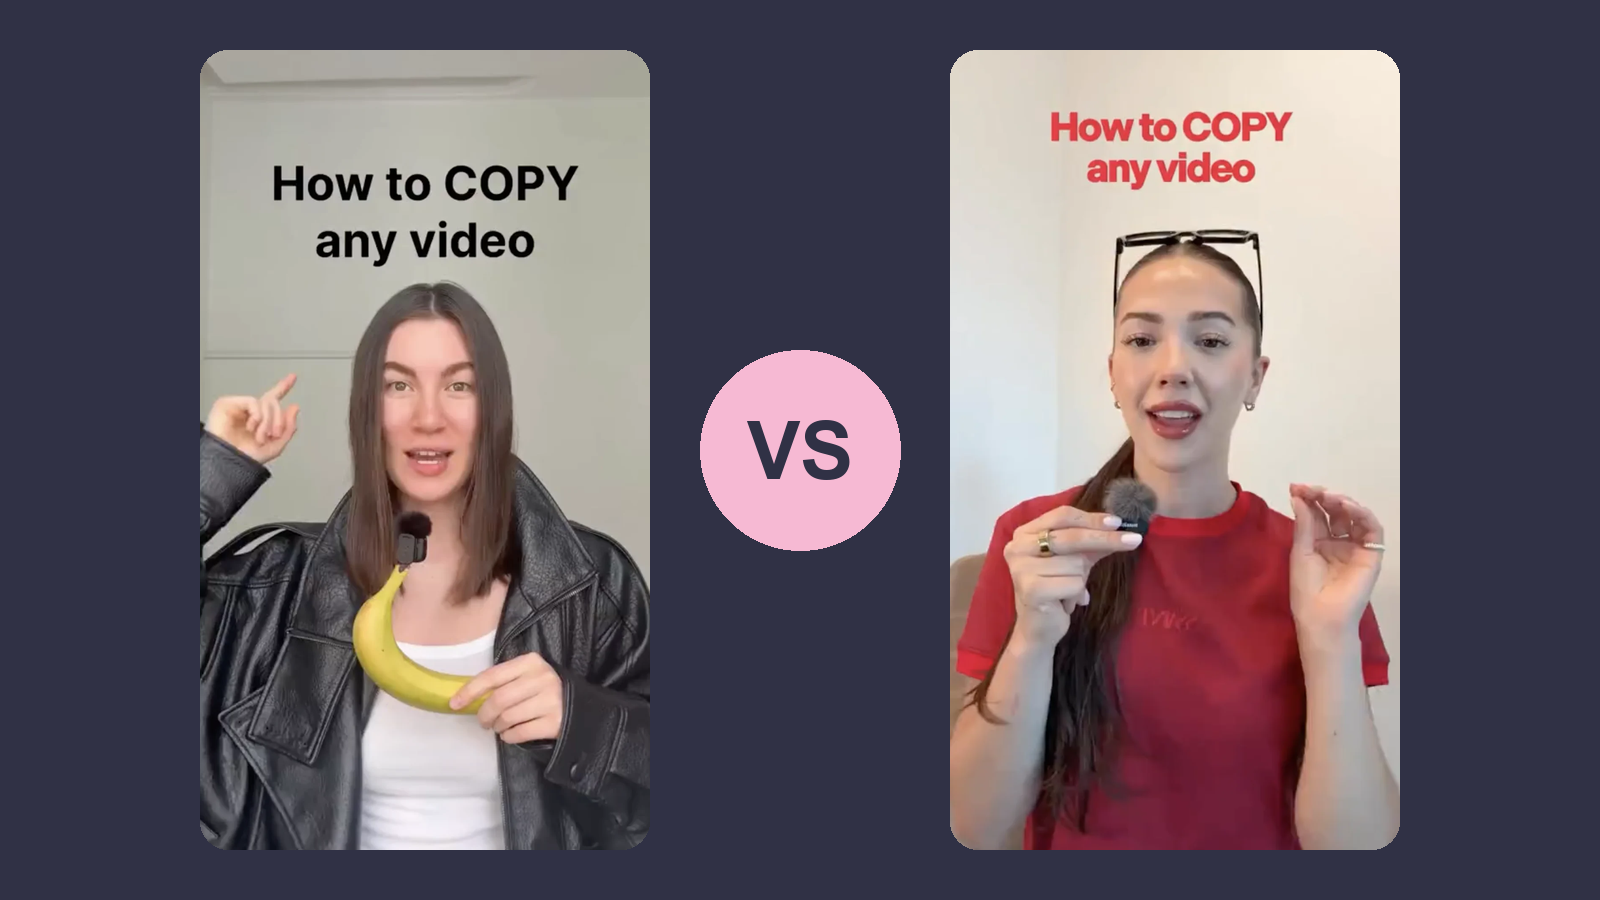
The same hook, word for word. One video got 1.8M views, the other 232K.
Two tutorials taught the same trick with the same opening line, "How to COPY any video". One got 1.8 million views, the other 232 thousand. Eye tracking on real viewers shows the identical hook landed both times, and the gap lives in what each video asked the earned curiosity to carry: 15 seconds versus 26, and an ending almost nobody watched.
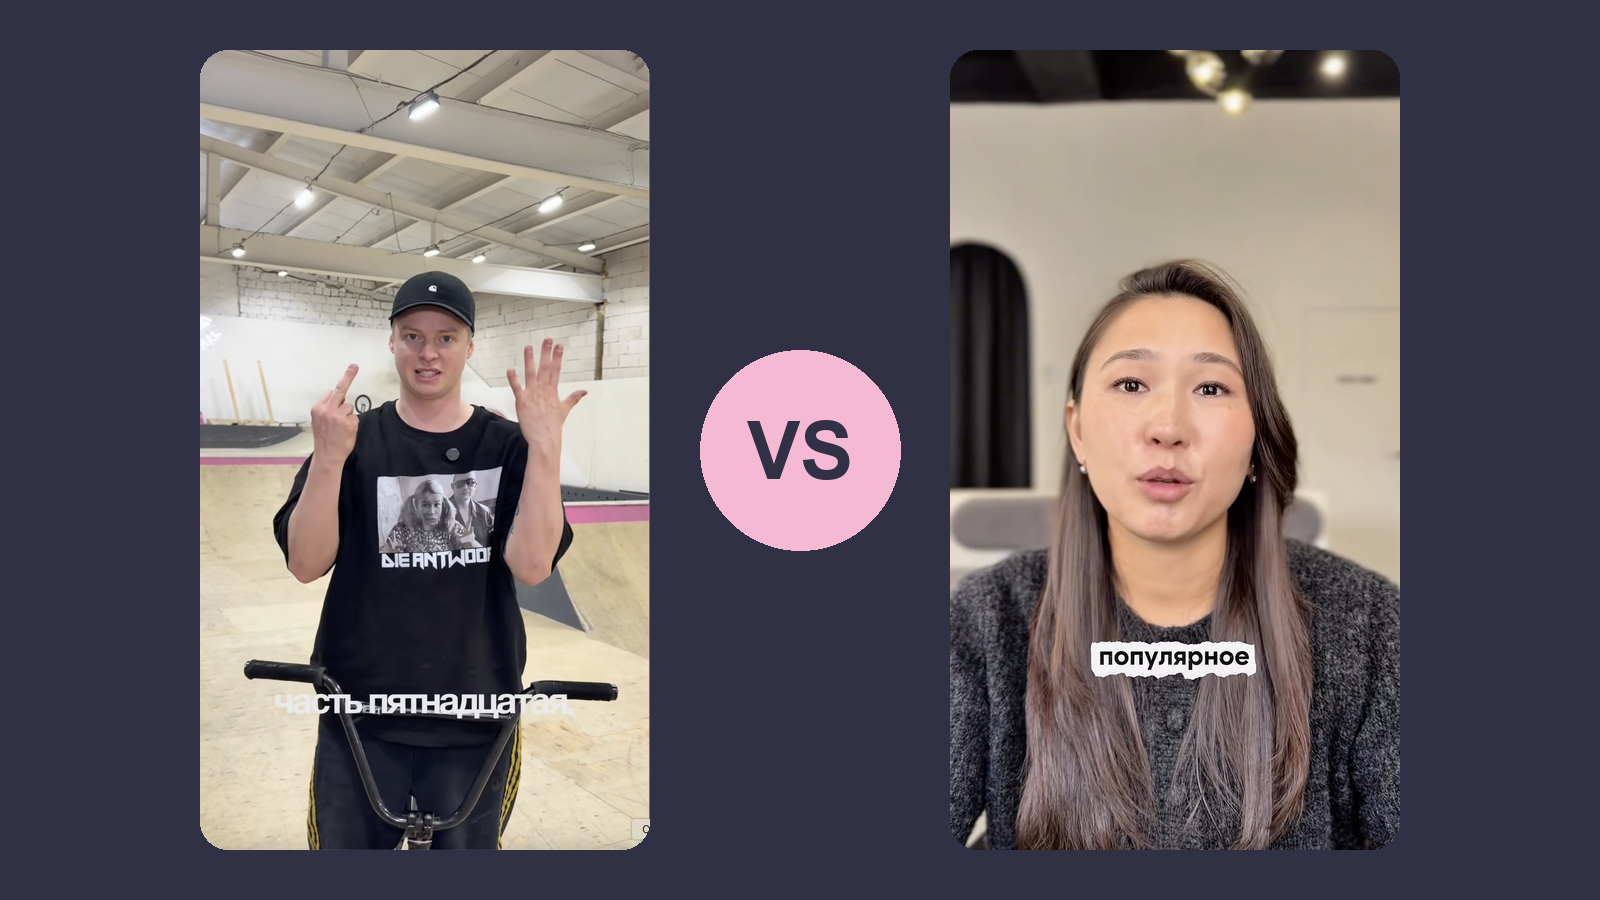
Children's camp invitations: who wins the parents, kids on camera or the founder?
Two creators invited parents to a children's camp. One built the video around kid reactions and a fast montage. One built it around the founder explaining the offer. Jeena ran both through real-viewer eye tracking and the gap that opened in the first seconds is already visible in the two hero stills.
Guides20
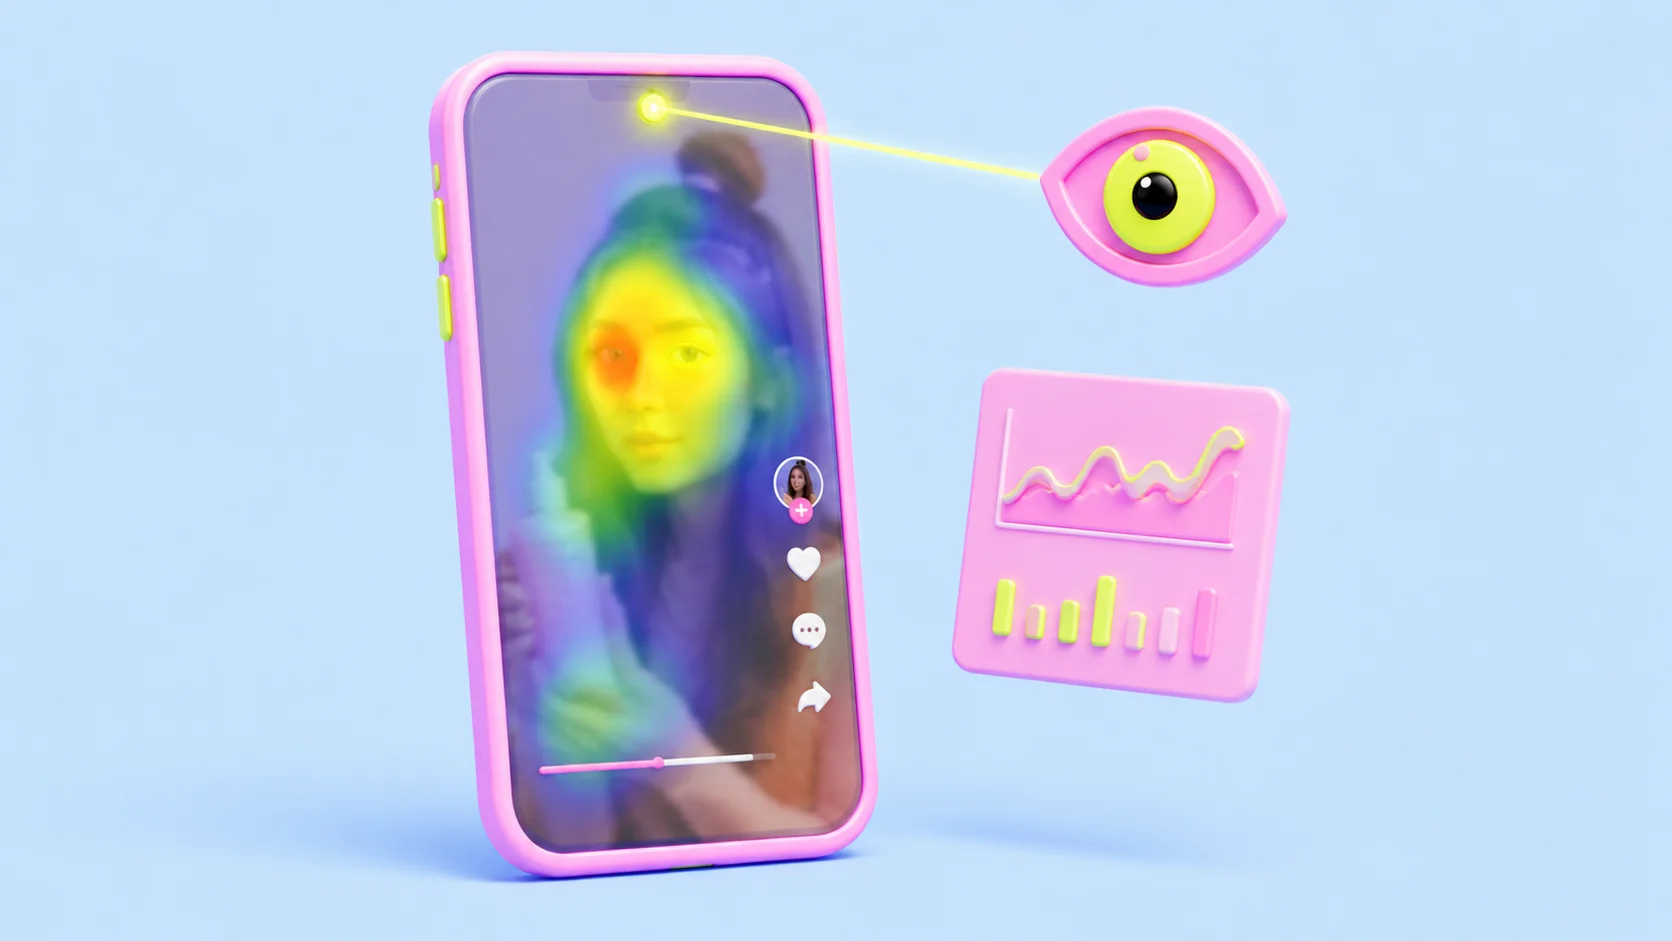
Eye tracking for short videos: how it works, what it shows, what it costs
The definitive answer to "can I eye track my short videos?": how smartphone front-camera gaze tracking works, how it differs from lab rigs and webcam tools, what a test looks like end to end, what the attention heatmap and visibility map actually show, and why a test costs about as much as two coffees.

How to eye track your short videos without a lab
A practical guide to eye tracking your own short videos: the free approximations and what they miss, browser webcam tools and their desktop problem, smartphone front-camera panels, and when a full infrared lab is actually worth it. With the accuracy numbers vendors usually skip and a step-by-step for running your first test.
Your viewers see two degrees of your video at a time
Foveal vision, the sharp part, covers under one percent of the visual field. A viewer watching your video sees one small patch at a time and reconstructs the rest. Eye-tracking research, from 1935 picture studies to a 2025 memory experiment, on what actually gets seen in a short video, and what never does.
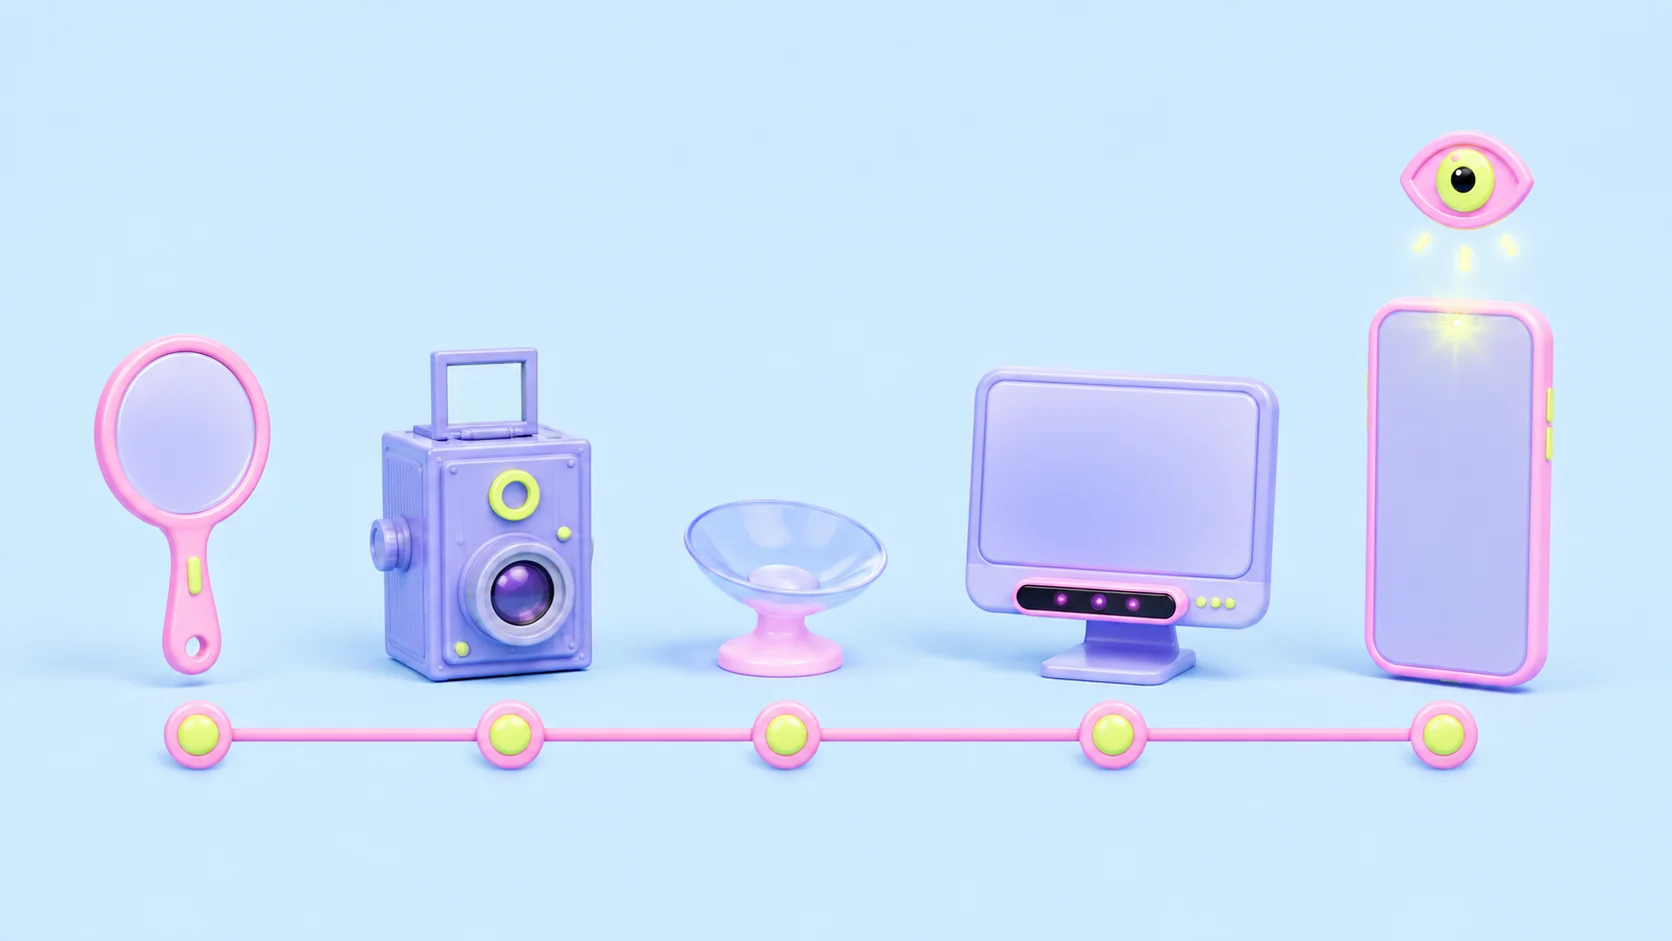
A short history of watching people watch: from metal mirrors to your front camera
In 1879 a Paris ophthalmologist discovered that reading eyes jump instead of glide. In 1935 a Chicago camera watched 200 people look at pictures. In the 1960s a Soviet physicist glued suction caps to eyeballs and proved that what we see depends on what we are asked. A history of eye tracking, ending at the front camera in your phone.

The 200-view jail: what it is, why it is not a jail, and what actually opens it
When videos keep stopping near 200 views, the community calls it view jail. The real mechanism is less dramatic: platforms test new videos on a small first audience and extend distribution only when that audience's behavior clears a bar. The video was not imprisoned; it sat an exam. What the exam grades, why shadowban explanations mostly miss, and how to prepare the next video for the only test that matters.
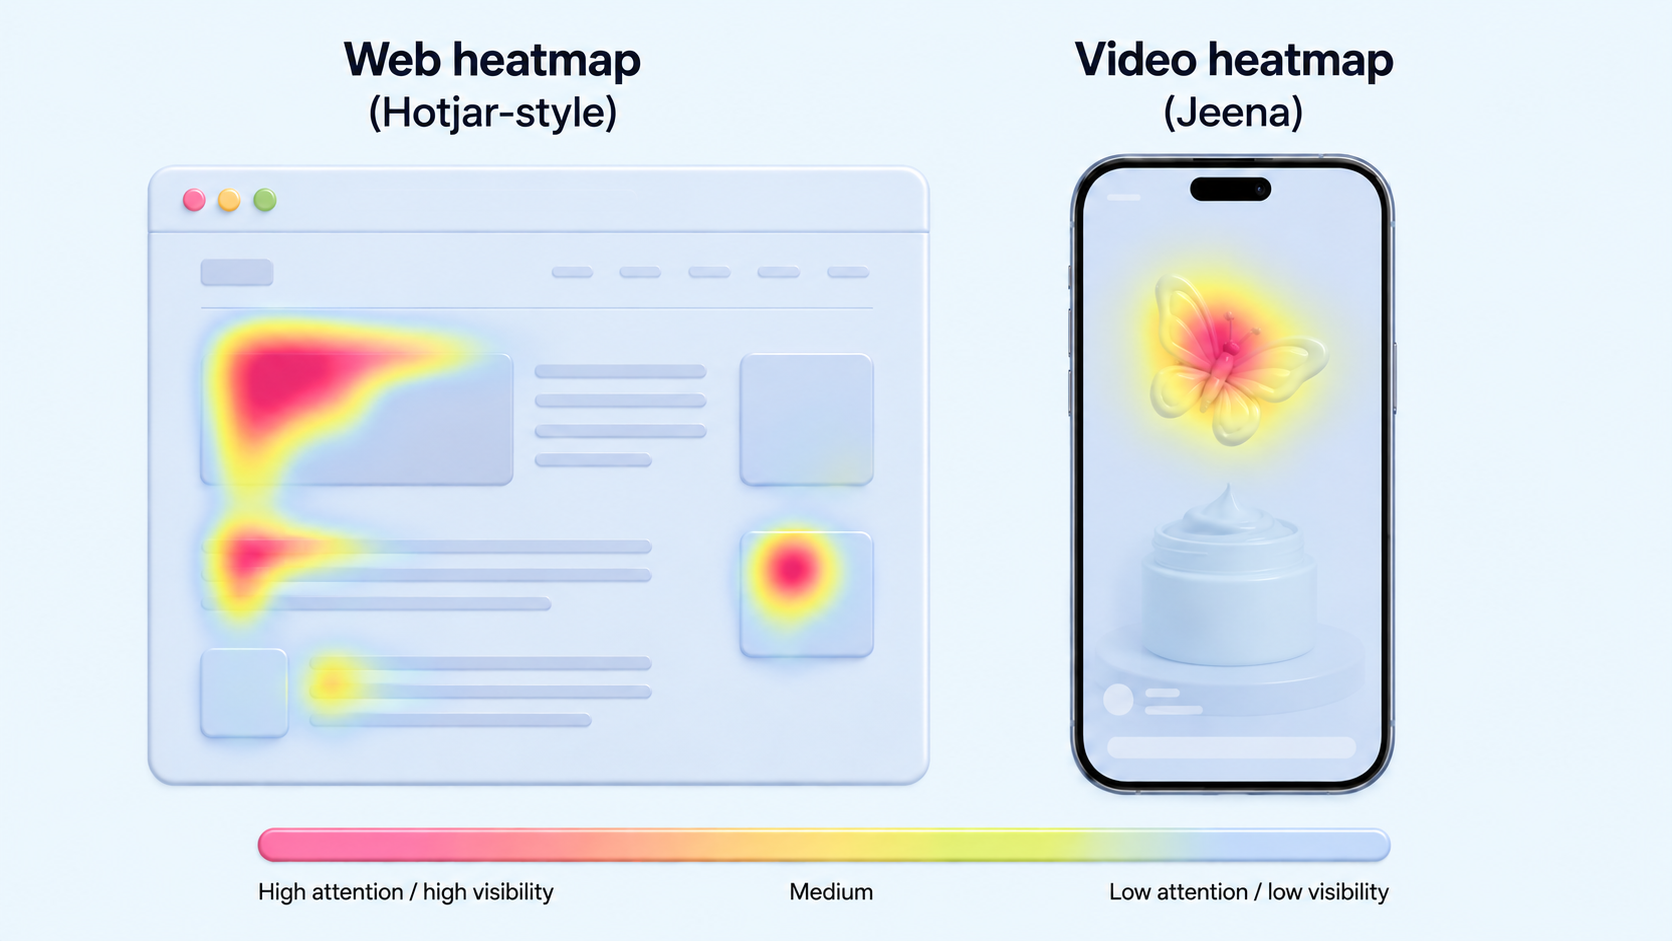
How attention heatmaps for short video work, and what they show that web heatmaps cannot
Web heatmaps treat the page as a static layout. Video heatmaps add a time dimension that changes everything: hot zones move, the gaze pattern is vertical rather than F-shaped, and the most useful signal is where viewers are not looking. How to read each one, with the failure modes of both.
Studies10
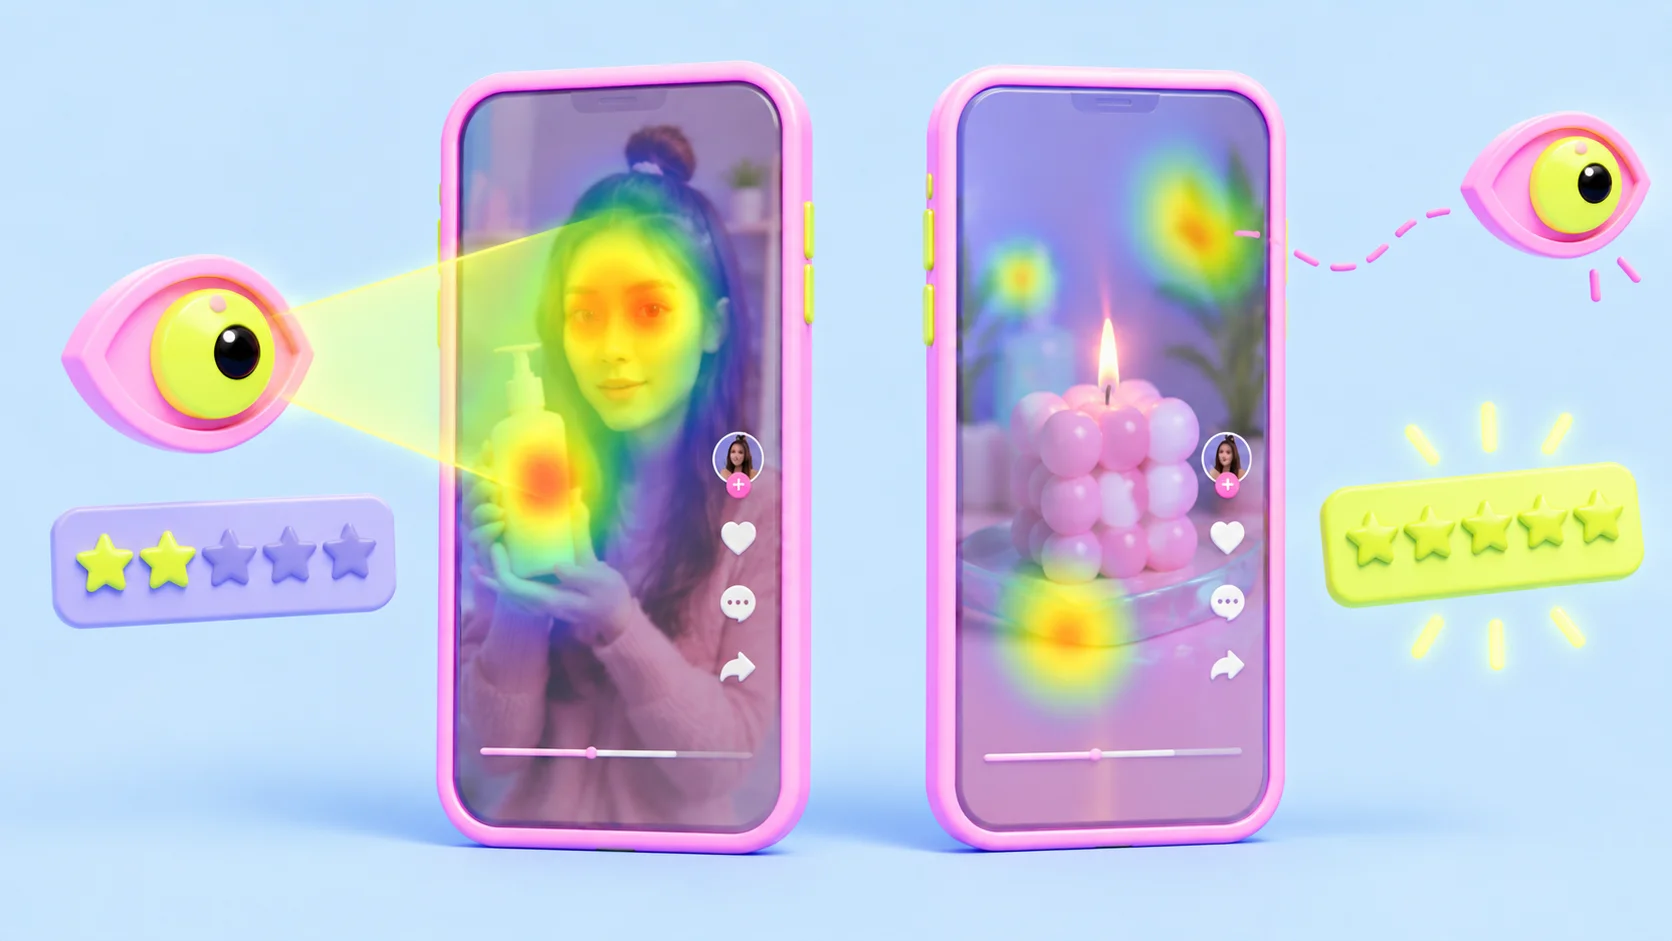
The Attention Paradox: the short videos people watch hardest are the ones they like least
Across ~530 eye-tracked viewing sessions, the videos viewers watched with the most visible concentration were the ones they rated lowest. Backgrounds out-pulled faces for on-screen gaze, captions barely registered, and liking was driven by the ear, not the eye. Our full findings, method, and what we are explicitly not claiming.
Everything eye tracking caught that analytics missed
A lab coat that beat its owner's face. A banana prop that ate a call to action. A mountain sky that out-competed a tutorial. Nine real findings from eye-tracking tests of short videos, each invisible to views, likes, and retention curves, and the one pattern that runs through all of them.
Short-form video statistics for 2026: only the numbers with real sources
The 2026 short-form video numbers that actually trace to a primary source: vertical HD uploads up 24% (Wistia, 13M videos), average Reel watch time at 8.5 seconds (Metricool, 24.4M posts), TikTok topping engagement at a 2.01% median (Quid), and where teams actually publish their clips. No recycled stats.
How long should a Reel be in 2026? The length benchmarks, sourced
The 2026 Reel length benchmarks from a 140,000-Reel study: 30-60 seconds wins reach, everything past 90 seconds pays a penalty, and the average viewer still leaves at 8.5 seconds. What the numbers say, where they mislead, and how to test whether your video earns its runtime.
Instagram Reels benchmarks for 2026: watch time, reach, and the 8.5-second reality
The 2026 Instagram Reels benchmarks, sourced: 8.5 seconds of average watch time, reach rates from 9.78% for small accounts down to 5% for big ones, skip rates above 60%, and what those numbers mean for how you should build the first third of every Reel.

Instagram engagement rate benchmarks for 2026: 0.30% is the new normal
The 2026 Instagram engagement benchmarks with sources: the 0.30% median, the 0.48% average, why those differ, which formats earn the most engagement (carousels edge out Reels), and a practical way to diagnose an account that sits under the line.