How attention heatmaps for short video work, and what they show that web heatmaps cannot
Web heatmaps made the field mainstream. Video heatmaps run on different rules.
Why I wrote this
A lot of small-business owners I talk to about Jeena have used Hotjar or Microsoft Clarity on their websites. They know what a heatmap is. They have looked at their own landing page and seen the bright spots clustered near the top, the dead zones at the fold, the rage clicks on a non-clickable element. That gives me a useful shortcut into the conversation. They already know the tool. They have just never seen it run on video.
But once we start showing them the Jeena report, the differences become obvious in a way that needs explaining. Video heatmaps are not just web heatmaps with a play button. The rules change. So this is the short version of how to read them, written for someone who already understands the web version.
What is the same
Both kinds of heatmap visualise where attention concentrates. Hot colours mark where the eye lands. Cool or absent colours mark where it does not. In both, you read for clusters, gaps, and the relationship between intended focal points (where the designer or creator wanted the eye to go) and actual focal points (where the eye actually went).
In both, the most useful insight is usually in the gap, not in the hottest spot. The hottest spot is often where you expected. The gap, the place where you assumed the viewer would look and they did not, is where the surprises hide.
What is different about video heatmaps
Time is the main axis
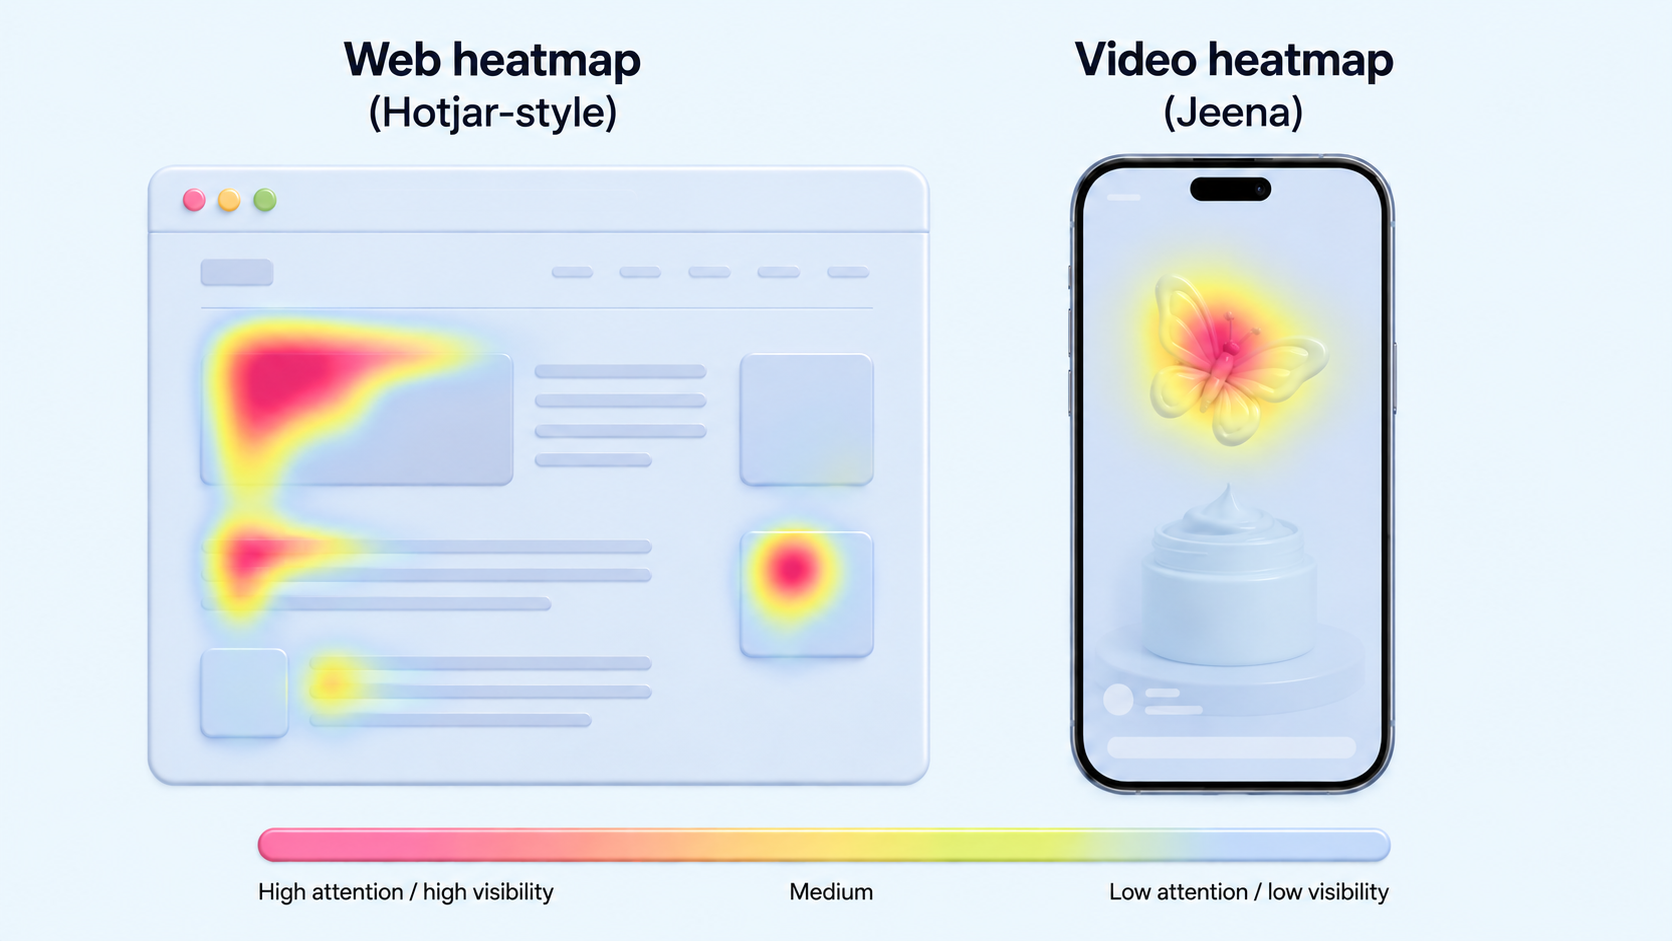
A web heatmap is one image of a layout. A video heatmap is a sequence. The hot zone at second one is in a different place than the hot zone at second eight. To read a video heatmap, you scrub through the timeline and watch the heat move. A single composite image (average attention across the whole video) is almost useless. The interesting information is in which second the heat shifted, and to what.
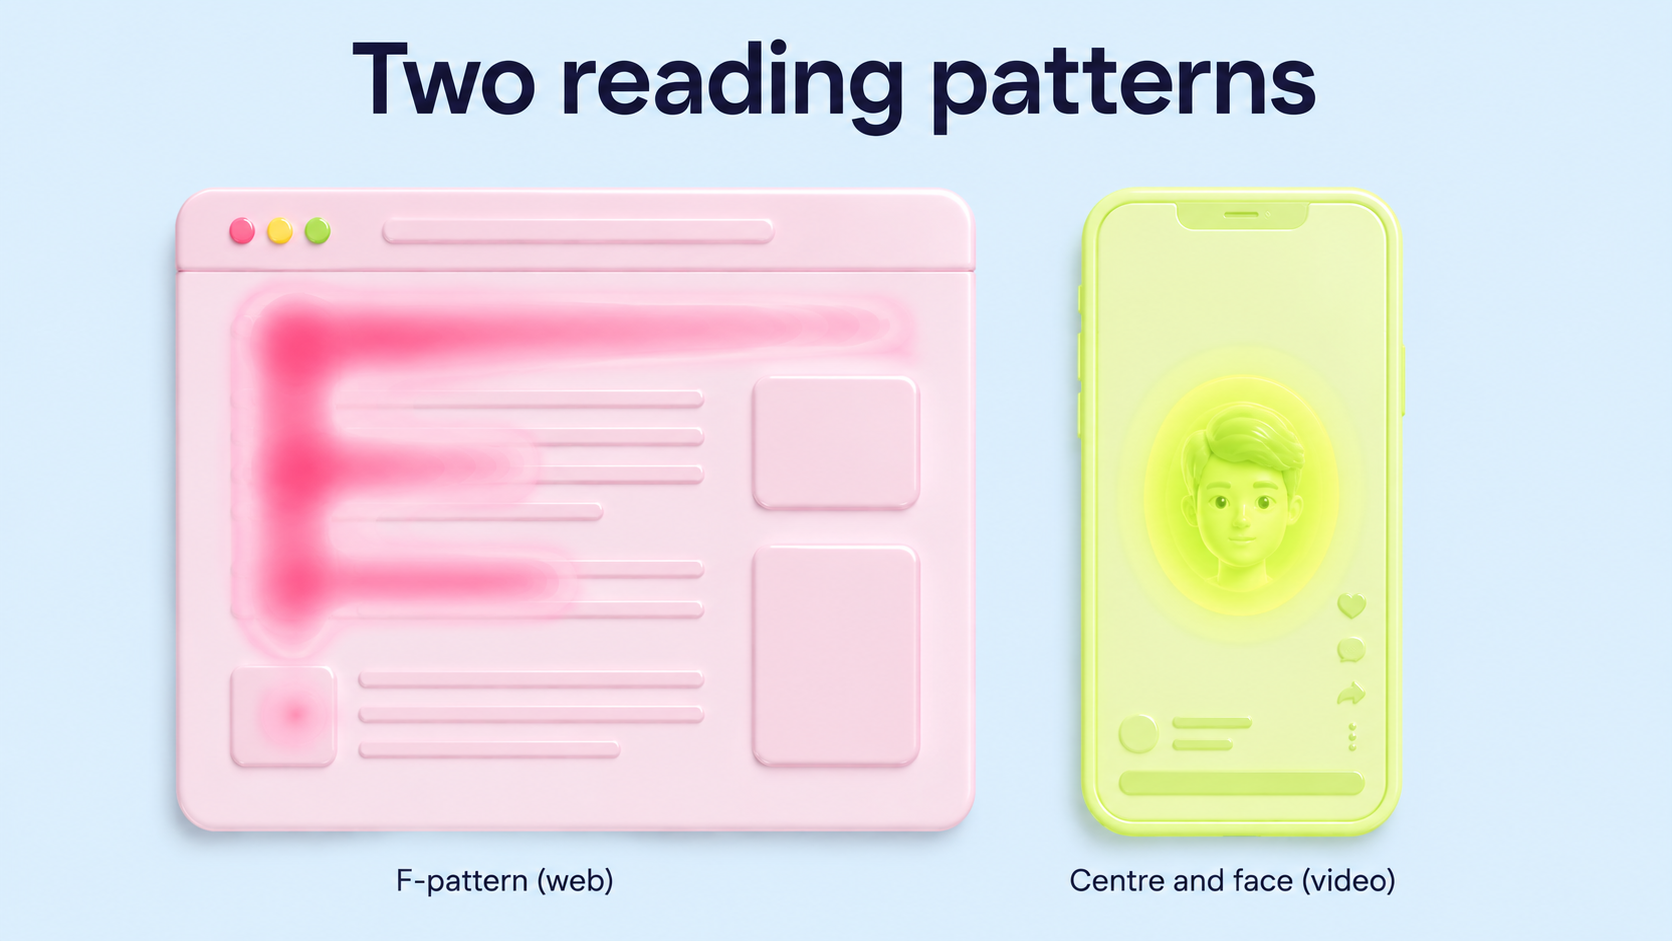
The reading pattern is vertical, not F-shaped
Web pages get read in an F-pattern (left side, top to bottom, with horizontal scans at the headings). Vertical video lives inside a phone-shaped frame that fills the visual field. The default gaze pattern is centre to slightly-above-centre, with quick saccades to faces, motion, and text. There is no F-pattern. There is the centre, the face, and the title text, and the eye moves between those three. Knowing that tells you where to put what you want seen.
Gaze is not click
A web heatmap tracks clicks because clicks are the conversion event. A video heatmap tracks gaze because the conversion event in video is staying watching. The two are different orders of intentionality. A click is a decision. A gaze is an involuntary attentional landing. Gaze data is closer to where attention actually went, before the viewer rationalised it. Click data is where they acted on it. Both matter; they answer different questions.
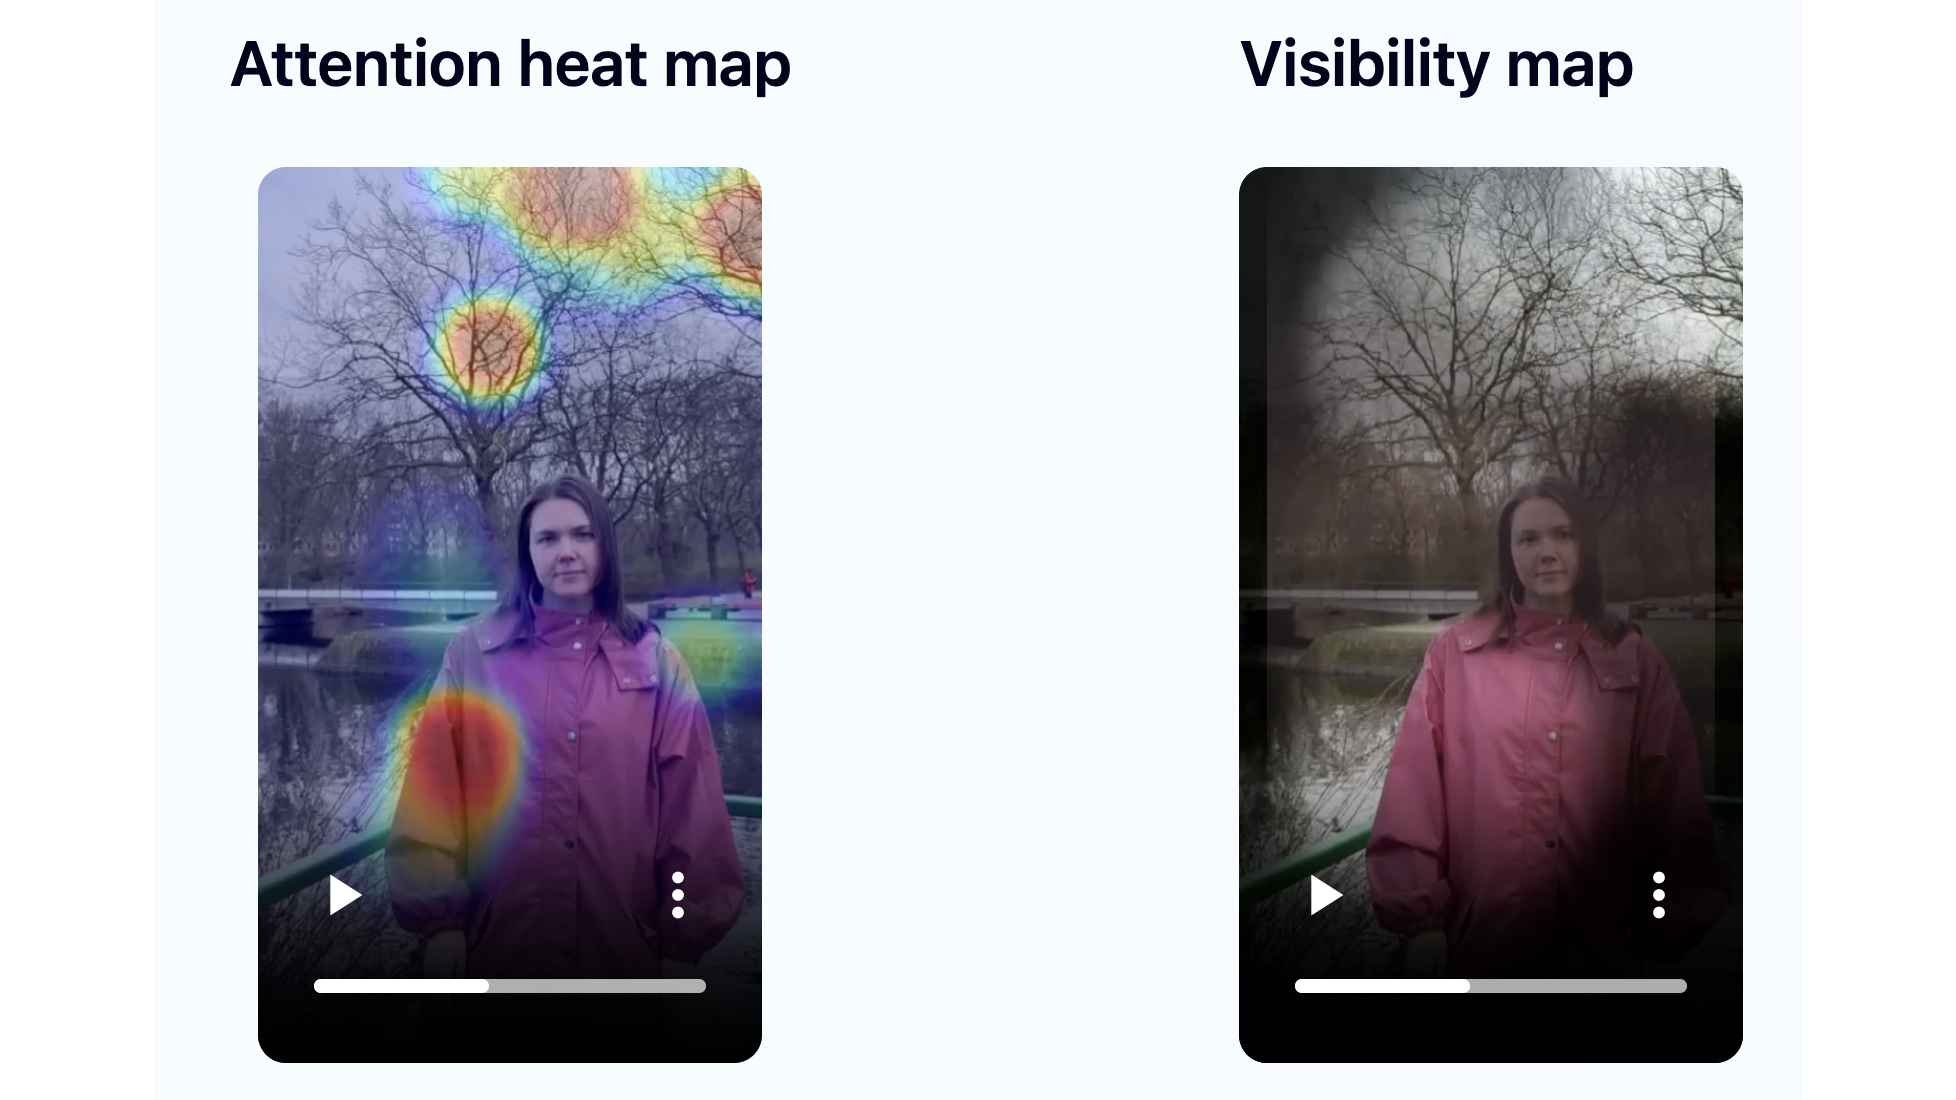
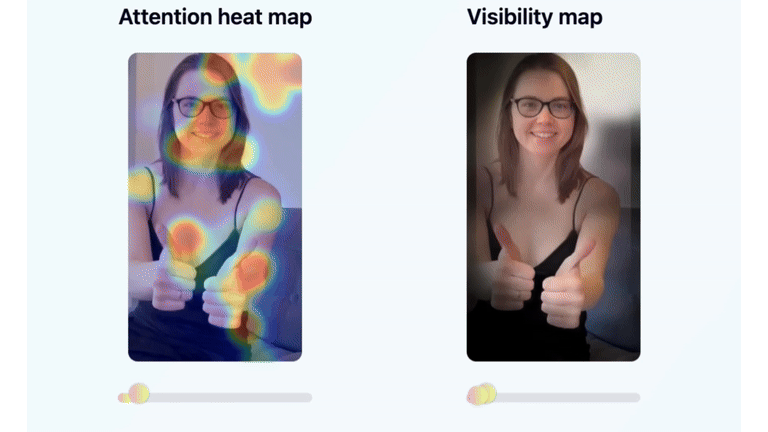
Visibility maps complement attention maps
A web heatmap shows the hot spots. A video visibility map (the inverse) shows the dim zones, the parts of the frame the viewer never looked at. For video, the visibility map is often more useful, because vertical video has a small visual field and assuming "they probably saw the corner caption" is wrong most of the time. The dim zones tell you what to remove or move.
A web heatmap is one image. A video heatmap is a sequence. The interesting information is in the seconds where the heat shifted, and to what.
The two questions to ask of any video heatmap
First: in the first three seconds, where did the gaze actually land? If it landed on the thing you wanted seen (the title, the face, the product), the hook is working. If it landed somewhere else (the background, the caption corner, the chair behind you), the hook is leaking attention to scenery.
Second: in the rest of the video, when does the heat go diffuse? A diffuse heatmap (no clear hot spot) at second nine usually means the viewer disengaged at second nine but is still technically watching. That is the moment to add a pattern interrupt, not the moment to add more content.
How Jeena actually builds the heatmap
The heatmap you see in the report is the visible output of three measurement layers running underneath. It helps to know what each one is doing if you want to interpret the colours sensibly rather than just nodding at the picture.
- Gaze sampling at 15 frames a secondEach viewer calibrates once on their phone, then watches your video with the front camera on. The platform samples gaze 15 times per second, recording the screen coordinates of where the eye actually landed. Those samples feed into the aggregation step; you never see one viewer's track on its own.
- Aggregation across the panelUp to 10 viewers contribute samples (minimum 5). Their per-frame gaze points are aggregated into the colour gradient you see. Where many viewers landed at the same pixel cluster at the same time, the heatmap lights up. Where no one looked, the visibility map shows a dim zone.
- Time stacked on top of everythingA web heatmap is one image. A Jeena heatmap is a sequence of images, one per moment in the video timeline. You scrub through it the same way you scrub through the video itself. The story is in how the hot zones move from second to second, not in the average across the whole clip.
What a diffuse-heatmap moment looks like in a real audit
Imagine a 12-second video where everything is tight through second 8: the aggregated heatmap has a clear hot zone on the speaker. Then at second 9 the heatmap goes pale. No new hot zone forms; the existing one fades. By second 11 the gradient is mostly grey-blue across the frame.
That diffuse moment is the actionable signal. The viewer is technically still watching (they have not swiped) but their attention has left. The fix is not to add another sentence here. The fix is a pattern interrupt in the frame just before second 9, so the eye has a reason to re-engage.
What this means if you have only ever used Hotjar
The mental model from web heatmaps transfers, but the controls are different. You are now reading a sequence, not a snapshot. You are reading gaze, not clicks. And the vertical aspect of the phone screen means the geometry of attention is centre-and-face, not F-pattern.
The questions you trained yourself to ask of a web heatmap (where is the eye landing, where is the dead zone, is the call-to-action in the hot zone) still apply. You just ask them one second at a time, and the answer can change every two seconds.
The biggest practical shift is that the visibility map (the dim inverse of the heatmap) tends to be more actionable than the heatmap itself for short video. On a web page, the dim zones are usually just the parts of the page below the fold. On a video, the dim zones are the parts of your frame you decided to use and that the viewer never registered. Those are the parts to cut or move.
Get an attention heatmap and a visibility map for your own video
Upload your video to Jeena. Real viewers watch it on their phones with the front camera on, and Jeena builds both the attention heatmap and the visibility map for the full timeline. You see, second by second, where viewer eyes landed and where they never did. The wow-moments chart adds the eyebrow-raise overlay so you also see when the gaze was paired with a real reaction.
No "schedule a call." No sales rep. Upload, get your report in a couple of days, read the maps the same way you have been reading Hotjar.
Frequently asked
How is an attention heatmap for video different from a Hotjar website heatmap?+
A web heatmap is one snapshot of where attention concentrates on a static layout. A video heatmap is a sequence of snapshots over time, because the hot zones move as the video plays. The reading pattern is vertical and face-centred rather than F-shaped, the input signal is involuntary gaze rather than intentional click, and the inverse (the visibility map showing dim zones) is often more actionable than the heatmap itself.
What is a visibility map and why does it matter for short video?+
A visibility map is the inverse of the attention heatmap: it highlights the parts of the frame that viewers did not look at. For short video, where the frame is small and every element competes for attention, knowing what was ignored is often more useful than knowing what was watched. If the corner caption you spent time designing is in a dim zone, viewers never registered it, and the fix is to remove it or move it to where the eye is actually going.
Can I use web heatmap intuition (Hotjar, Microsoft Clarity) when reading video heatmaps?+
Partially. The instinct to look for hot spots, dead zones, and the gap between intended and actual focal points transfers. The reading pattern (F-shape on web, centre and face on video) does not. The static-image interpretation (the heatmap is one image) needs to be replaced with a sequence-of-frames interpretation, because in video the hot zone at second one is usually not the same as at second eight.
What is Jeena?+
Jeena is a neuromarketing platform for short-form video. Real people watch your video on their phone with the front camera on. Jeena captures their gaze direction, blink rate, eyebrow raises, and their impressions of the video in a short survey afterward. You receive an AI-powered report with an attention heatmap, a visibility map, a wow-moments chart, a summary of how viewers perceived the video, and three specific recommendations for making the video work harder.
How does Jeena measure viewer attention?+
Jeena uses smartphone front-camera gaze tracking. Each engager calibrates once, then watches your video. The platform records where their gaze lands frame by frame, flags moments of surprise from facial expression, and combines that with a short impressions survey afterward. The result is a per-second timeline of what real viewers actually looked at and felt, plus a summary of how they perceived the video overall.
How much does it cost to test a video on Jeena?+
A typical test costs around ten euros. See the pricing page for current rates.