The Attention Paradox: the short videos people watch hardest are the ones they like least
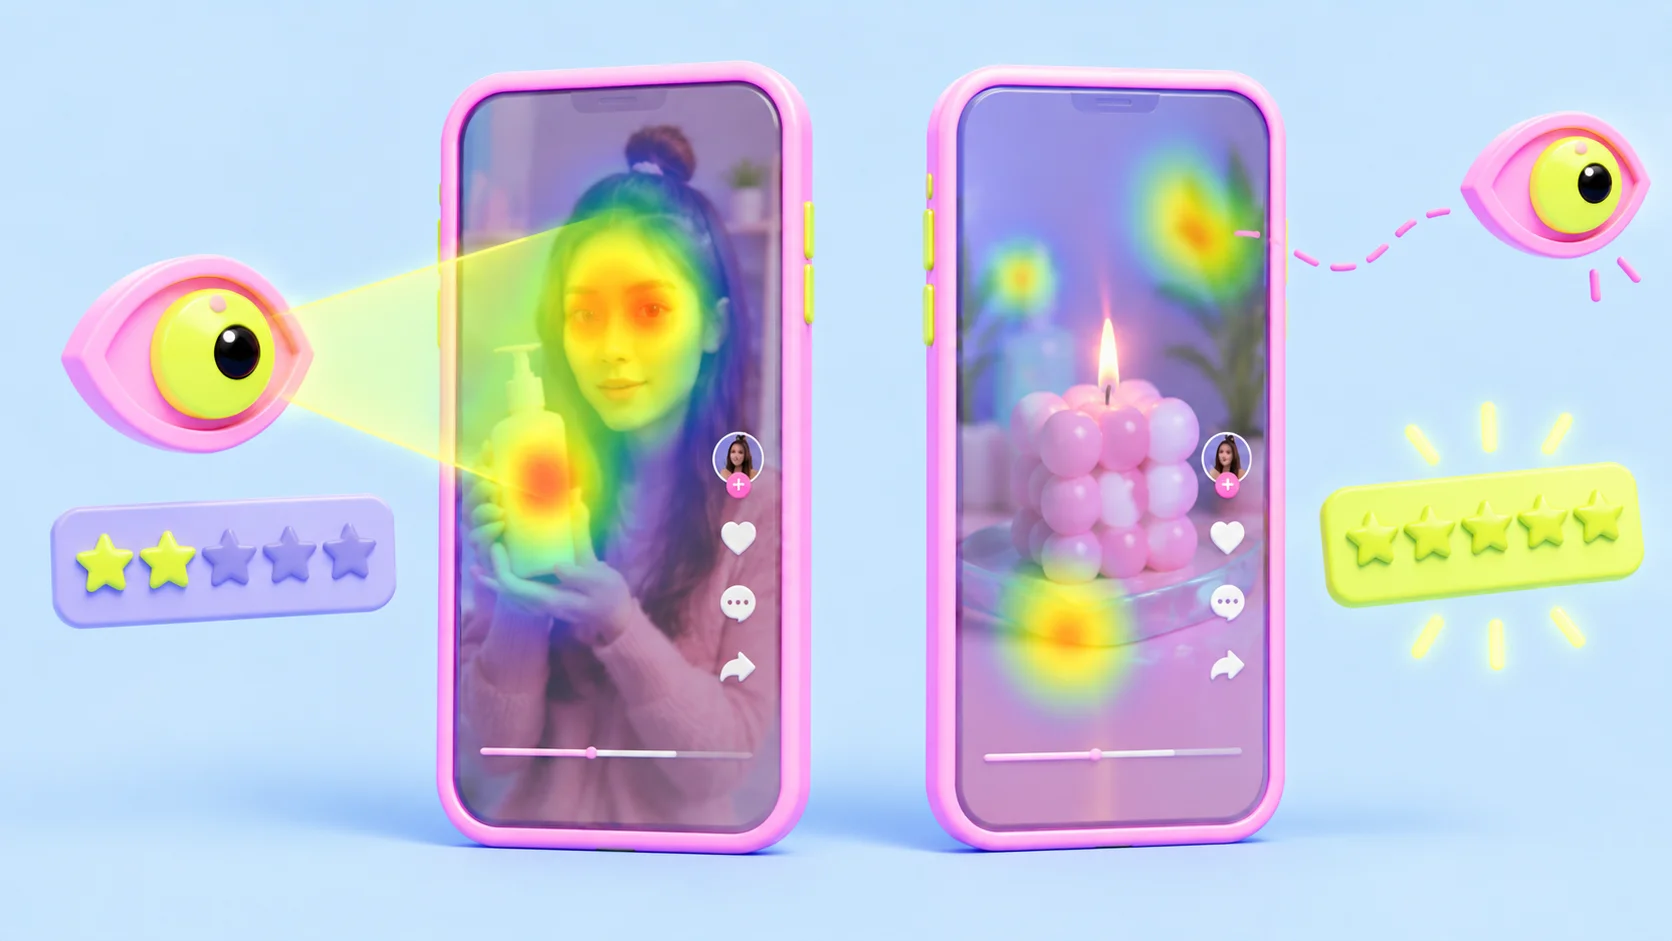
We tracked the eyes of real viewers across 89 short videos, about 530 viewing sessions, and the clearest pattern in the data breaks the most common assumption in short-form video: that holding the eye means winning the viewer.
Why we ran this
Everything in short-form video optimization assumes one equation: more attention equals better video. Retention graphs, watch-time metrics, "stop the scroll" advice, all of it treats the viewer's eye as a scoreboard. We run an eye-tracking platform, which means we sit on the one dataset that can actually test the equation: not how long people kept a video on screen, but where their eyes physically were, frame by frame, and how they rated the experience afterwards.
So we audited every video processed on Jeena over four months: 89 short videos, roughly 6 real viewers each, about 530 viewing sessions, each with front-camera gaze tracking, a facial-focus measure, and a post-watch survey. We expected the data to confirm the equation. It inverted it.
The method, in one paragraph
Each video was watched by a panel of real viewers on their own phones with the front camera tracking gaze (viewers calibrate once; motion detection discards invalid watches). For every session we get per-scene gaze coordinates, including whether the eyes were on the frame at all, a concentration measure derived from facial focus, and a 1-to-5 post-watch liking score with emotion tags. The audit correlates those three signals across all videos and sessions; the scripts and per-video metrics are reproducible internally, and every claim below survives the obvious confound checks we could run (the big one, video duration, is addressed directly).
Finding one: attention and liking pull in opposite directions
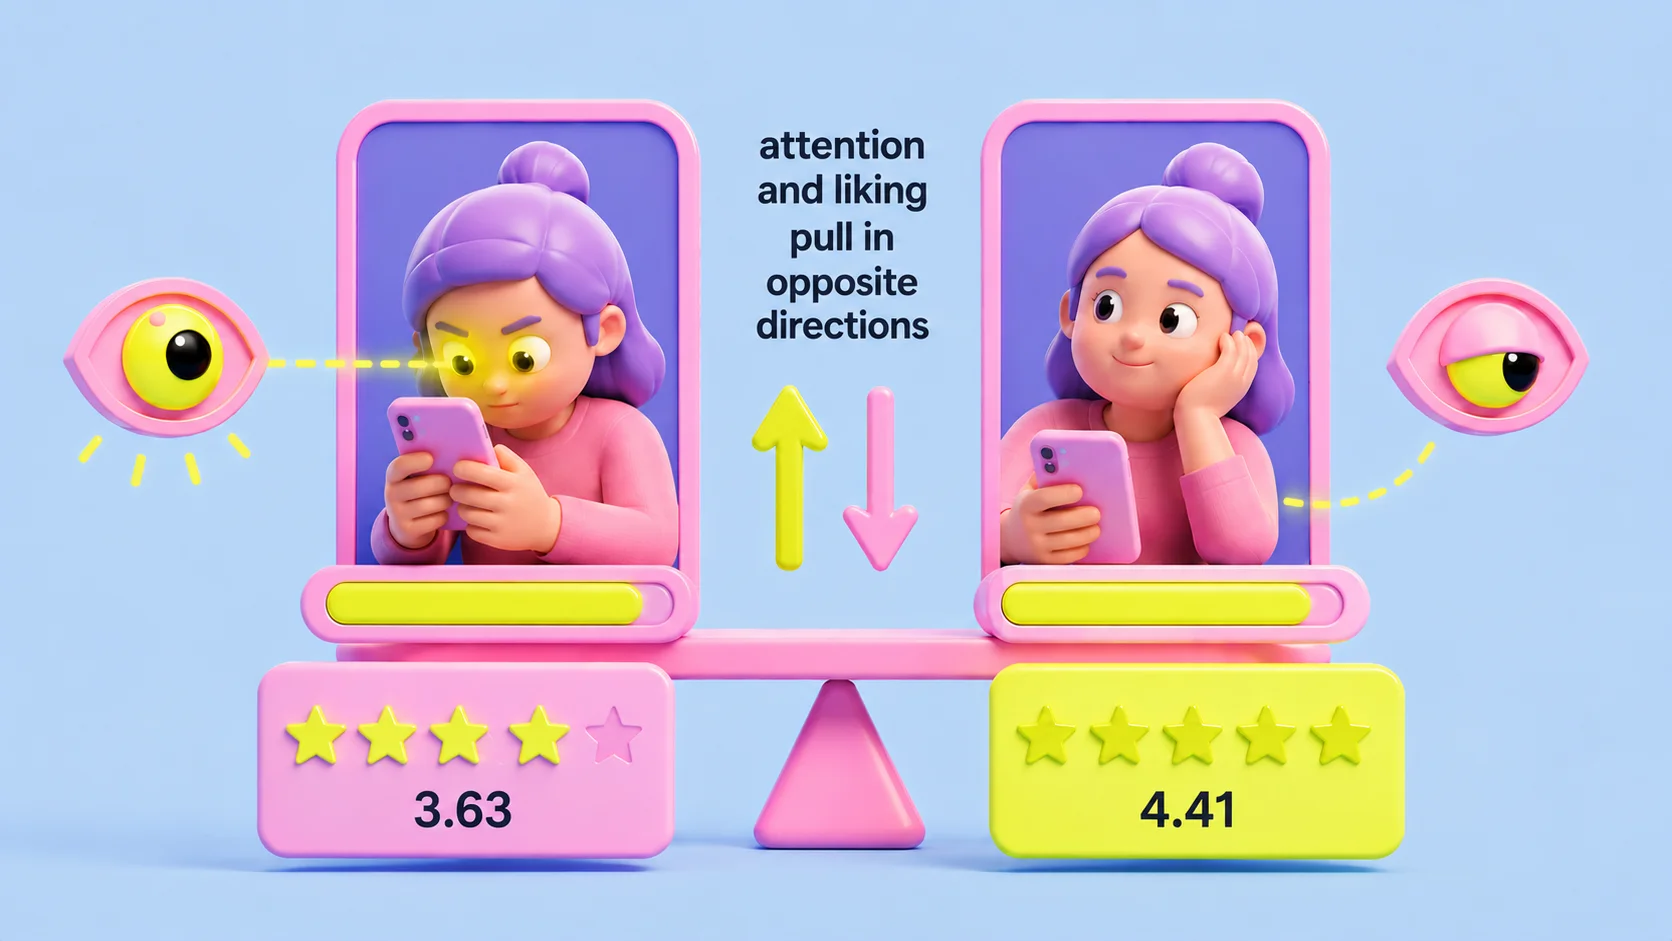
Every session in the study carries a concentration measure derived from the viewer's face: how intently they are visibly locked onto the video. Intuition says the videos that generate the most concentrated watching should be the best ones. The data says the opposite, and it says it consistently: the harder the panel visibly worked at watching a video, the lower they rated it afterwards.
Quartiles make it concrete. The videos in the top quartile of concentration, the ones viewers physically watched hardest, averaged 3.63 on the 5-point liking survey. The bottom-quartile videos, the ones viewers watched most lightly, averaged 4.41. The same inversion shows up per viewer: the more intently an individual watched a given video, the less they tended to like it. The scoreboard runs backwards.
No, it is not the duration talking
The obvious objection: maybe long videos force effortful staring and also bore people, manufacturing the pattern. We checked. The inversion holds inside every duration bucket, in videos under 30 seconds, in 31 to 60, and in over 60. Whatever produces the paradox, it is not video length.
The explanation the data supports: effort is not enjoyment
Look at what high-concentration videos have in common: dense on-screen text, complex explainers, a talking head making an argument you must follow. They demand staring to be understood, and the front-camera concentration signal captures exactly that: cognitive effort, lock-in, work. Viewers did the work, and then rated the experience like work.
The mirror case is the best-liked cohort: light, funny, premise-driven clips whose payoff lives in the voice-over and the idea, not the frame. The extreme example in our set is a 13-second "zero marketing budget" joke clip: its measured concentration was the lowest in the audit, and it scored 4.34, one of the highest ratings we recorded. Its opposite: a 9-second identity monologue that locked 58% of its on-screen gaze onto the speaker's face, produced the highest concentration in the dataset, and scored 2.33. Watched hardest, liked least, one video each way, and the whole dataset in between agrees.
If your video only works when someone stares at it, that is not a strength. In our data, it is the signature of videos people rate lowest.
Finding two: the ear decides
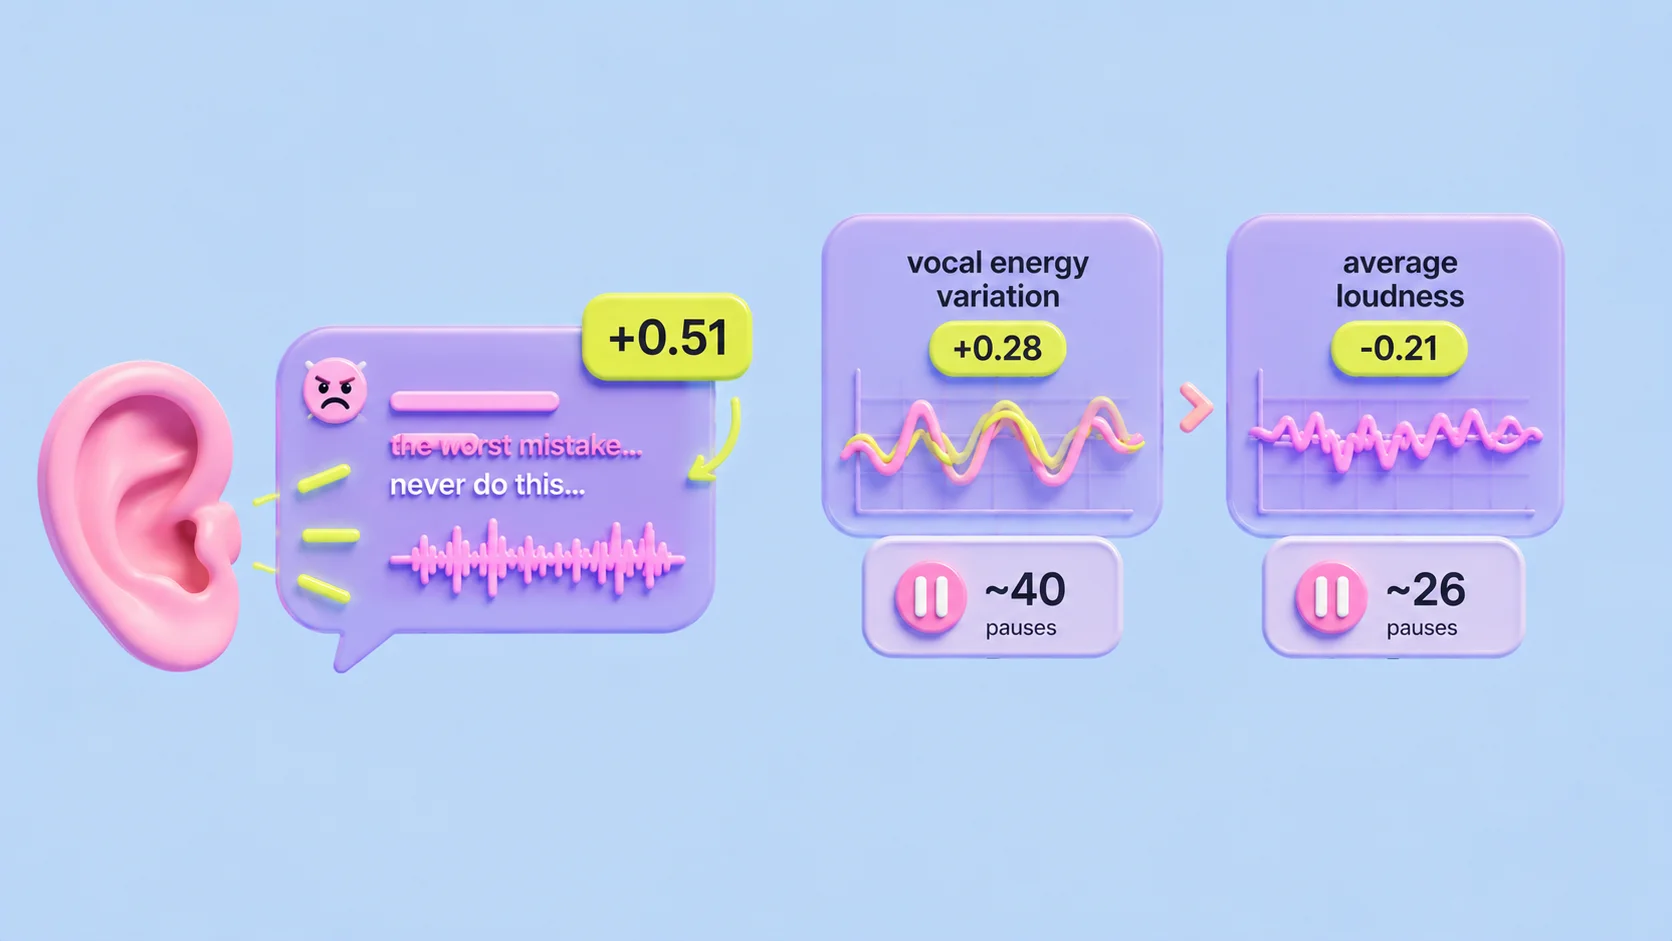
If the eye does not drive liking, what does? The audio track. The single strongest verbal lever in the dataset is emotional stakes in the speech: the share of negative-sentiment language ("the worst mistake...", "never do this...") correlated +0.51 with liking. The top-liked quartile of videos was 38% negative-sentiment speech; the bottom quartile, 3%. A thirteen-fold gap, and it is not an outlier effect, the median video already runs 26% negative.
Delivery follows the same logic. Vocal energy variation correlated +0.28 with liking while average loudness correlated −0.21: dynamic-with-pauses beats uniformly loud. Top-liked videos contained roughly 40 pauses; bottom-liked, 26. And here is the detail that makes the two-channel model real: spikes in the voice track had zero measurable effect on where the eyes went next, at every time-lag we tested. The eye channel and the ear channel run separately, which means each needs its own instrument: the heatmap reads what the eye did, and the post-watch survey reads what the ear delivered. Measuring only one of them is how videos get misjudged.
Where on-screen gaze actually lands
| Region | Share of on-screen gaze |
|---|---|
| The subject, object, or product | 47.7% |
| The background | 25.5% |
| Faces | 17.7% |
| Captions and on-screen text | 7.4% |
| Interface elements | 1.7% |
Finding three: backgrounds beat faces, and captions barely register
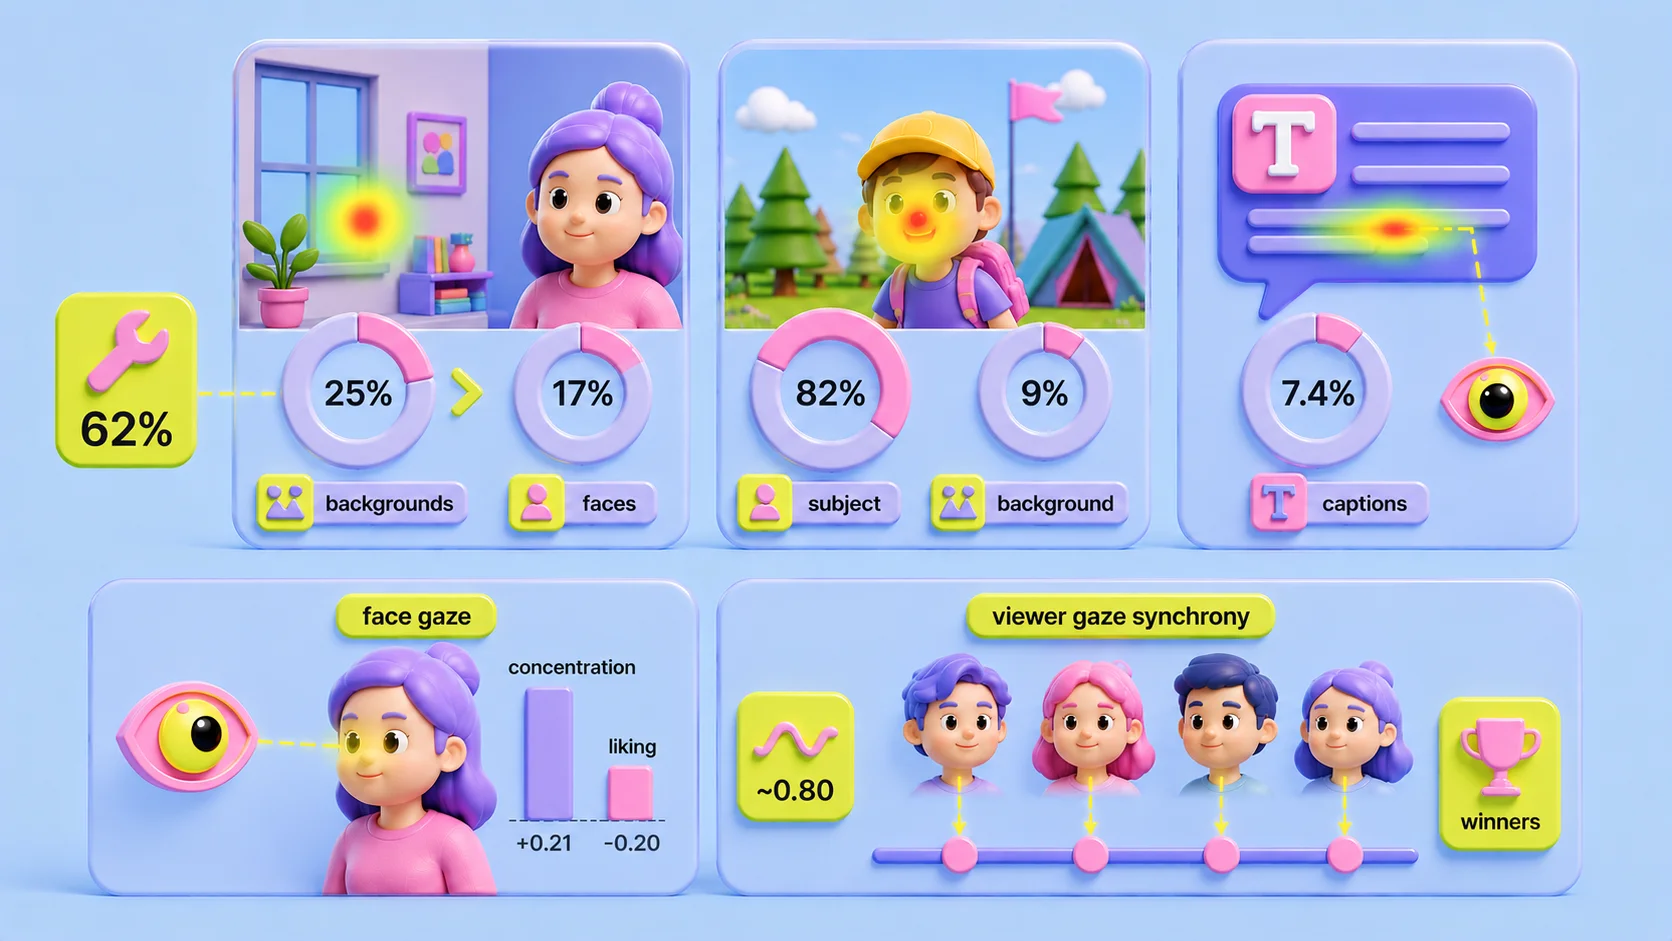
Backgrounds out-pull faces. A quarter of all on-screen attention leaks to walls, windows, and clutter, more than lands on human faces, and background distraction was flagged as a fixable defect in 62% of the videos audited. The best-aligned video in the set (a children's camp promo where eyes and liking agreed) concentrated 82% of gaze on its subject and gave the background 9%.
Faces hold the eye but do not win the heart: face-gaze correlated positively with concentration and negatively with liking, the paradox in miniature. Captions, which appear in 83% of videos and dominate creator advice, drew 7.4% of gaze. And viewer gaze synchrony, where everyone looks at the same moment, ran uniformly high (~0.80) on winners and losers alike: directing the eye is mostly a solved problem. What the directed eye finds, and what the ear hears while it looks, is where videos separate.
What we would build differently after this audit
Produce for two channels, and let the ear carry the value
The eye channel determines what gets seen; the ear channel determines how it feels. Say something with stakes, vary the voice, breathe. A video that survives being half-watched, because the audio carries it, matches how all videos are actually consumed.
Front-load the moment you are proudest of
Only 18.5% of a video's total wow reactions land in its first five seconds: almost everyone saves the payoff for an ending many viewers never reach with full attention. Put a taste of the best moment in the opening frames, then deliver it in full.
Treat staring as a symptom, not a score
If viewers must lock onto your frame to follow it, you are extracting effort, and effort rates poorly. Simplify the visual load until the video works at a glance, then spend your energy on the soundtrack of it.
What we are NOT claiming
This is a panel study: paid test viewers watching assigned videos on their own phones, not an in-the-wild feed. It measures how a video lands with viewers, resonance, not how far an algorithm distributes it, and nothing here predicts raw view counts. The correlations are associational; the effort-versus-enjoyment mechanism is our best-supported reading, not a controlled result. Sample: 89 videos, 88 with complete gaze data, roughly six viewers each.
And one number in this study argues against over-trusting studies: the failure mode of short video in our survey data is not "bad", it is "forgettable". Negative reactions were rare; mild interest was everywhere. Whatever you take from our findings, the bar they describe is memorability, and no correlation writes a memorable video for you.
Using this on your own videos
Every metric in this study comes from the standard report Jeena produces for any uploaded video: the gaze data behind the attention heatmap, the region split, the visibility map, the survey. If you want to know which side of the paradox your video sits on, whether it is being watched with effort or enjoyed at a glance, that is a ten-euro question now.
The aggregate patterns continue in two companion pieces: how people actually watch short videos covers the vision science under these numbers, and the findings roundup collects what per-video tests caught that no dashboard could.
Frequently asked
What is the attention paradox in short-form video?+
The finding, from our eye-tracking audit of 89 short videos (~530 viewer sessions), that the videos viewers physically watch most intently are the ones they rate lowest afterwards. The most-concentrated quartile of videos scored 3.63 on a 5-point liking survey versus 4.41 for the least-concentrated, the same inversion appears per viewer, and it holds within every duration bucket. The likely mechanism: intense staring marks cognitive effort (dense text, complex explainers), and effort is not enjoyment.
Does the paradox mean watch time does not matter?+
No. Platform algorithms reward watch time for distribution, and our study measures resonance (how viewers feel about a video), not reach. The practical reading is that the two are different targets: a video can hold eyes through effort and still leave viewers cold, which is a bad trade for follows, shares, and memory. The winning combination in our data pairs a glanceable frame with an audio track that carries stakes and delivery.
How was the study conducted?+
Every video processed on the Jeena platform over four months (89 videos, 88 with complete gaze data) was watched by panels of about six real viewers on their own phones, with front-camera gaze tracking, a facial-concentration measure, and a 1-to-5 post-watch survey with emotion tags. We correlated the behavioral signals against the stated ones across ~530 sessions, checked the duration confound explicitly, and published the caveats alongside the findings: panel setting, associational correlations, resonance rather than reach.
What is Jeena?+
Jeena is a neuromarketing platform for short-form video. Real people watch your video on their phone with the front camera on. Jeena captures their gaze direction, blink rate, eyebrow raises, and their impressions of the video in a short survey afterward. You receive an AI-powered report with an attention heatmap, a visibility map, a wow-moments chart, a summary of how viewers perceived the video, and three specific recommendations for making the video work harder.