Three creators made the same video about broke followers. The vibes leaked, the proof held.
A trending idea, three treatments: 16, 49, and 81 seconds, spanning 735K to 9.4K views. Jeena watched all three with real viewers, and the gaze data split every video into the part that leaked and the part that held.

Why I tested this
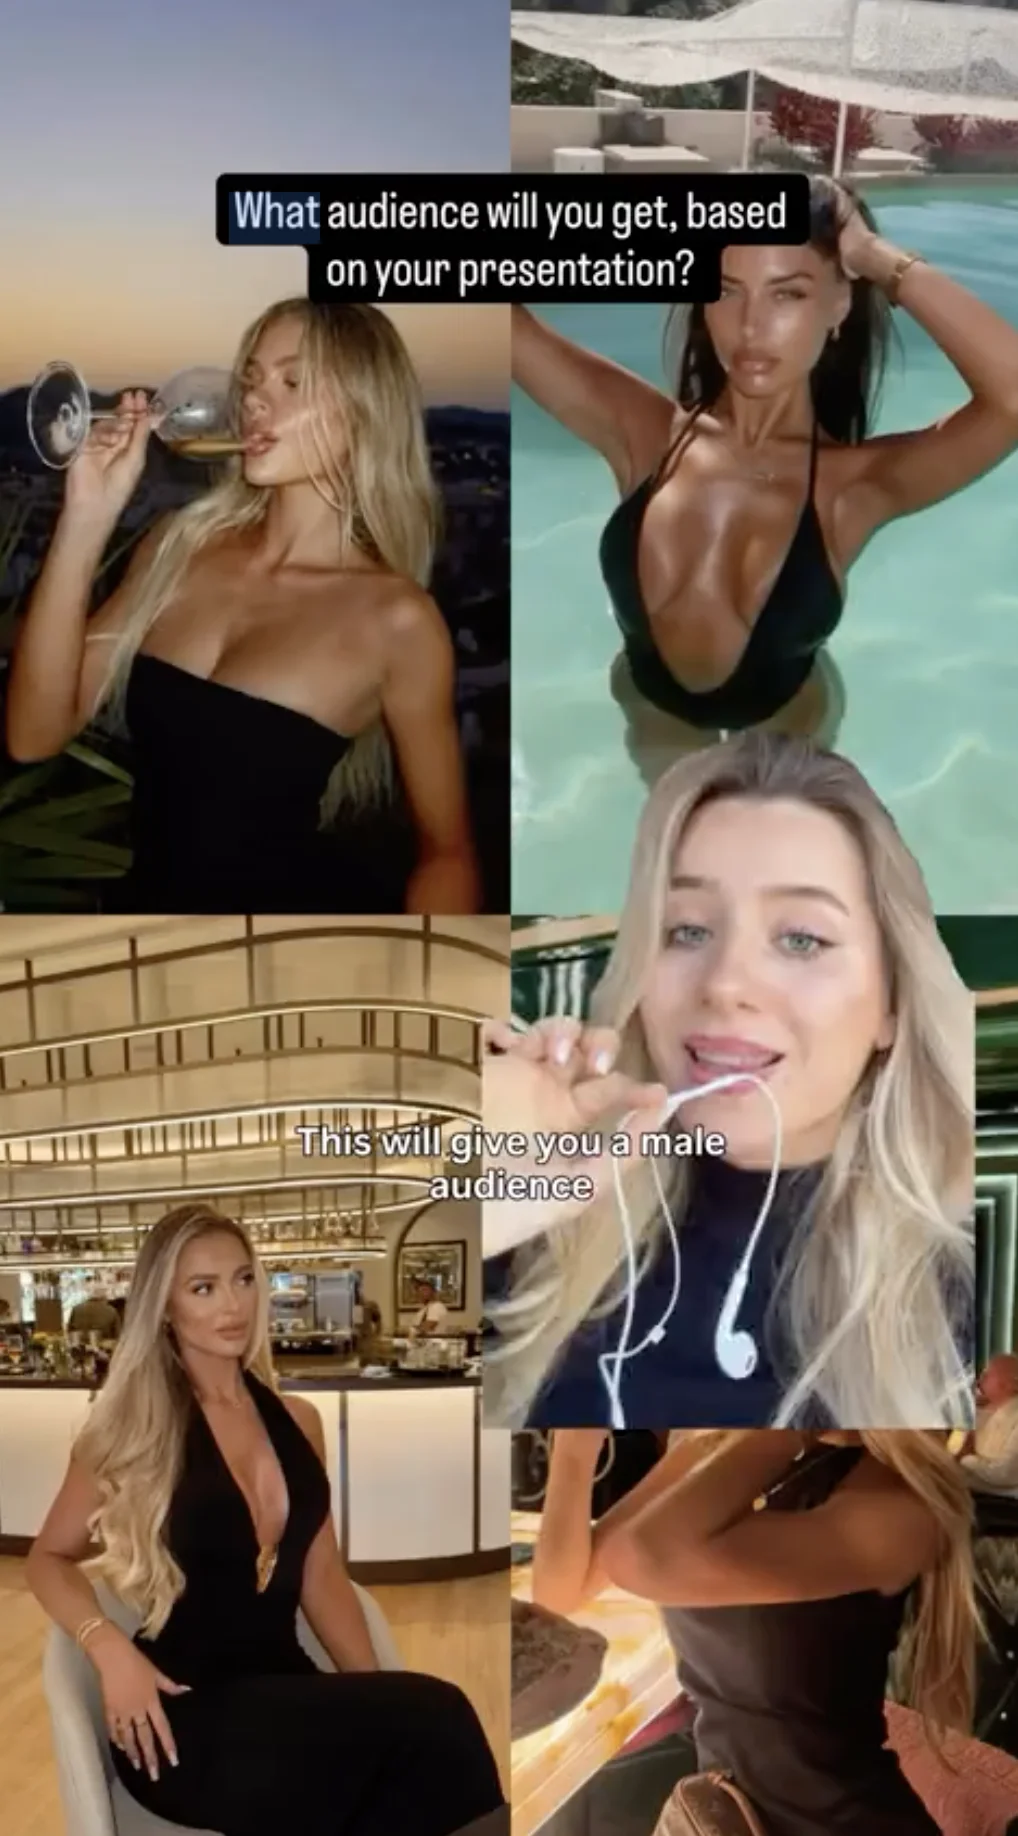
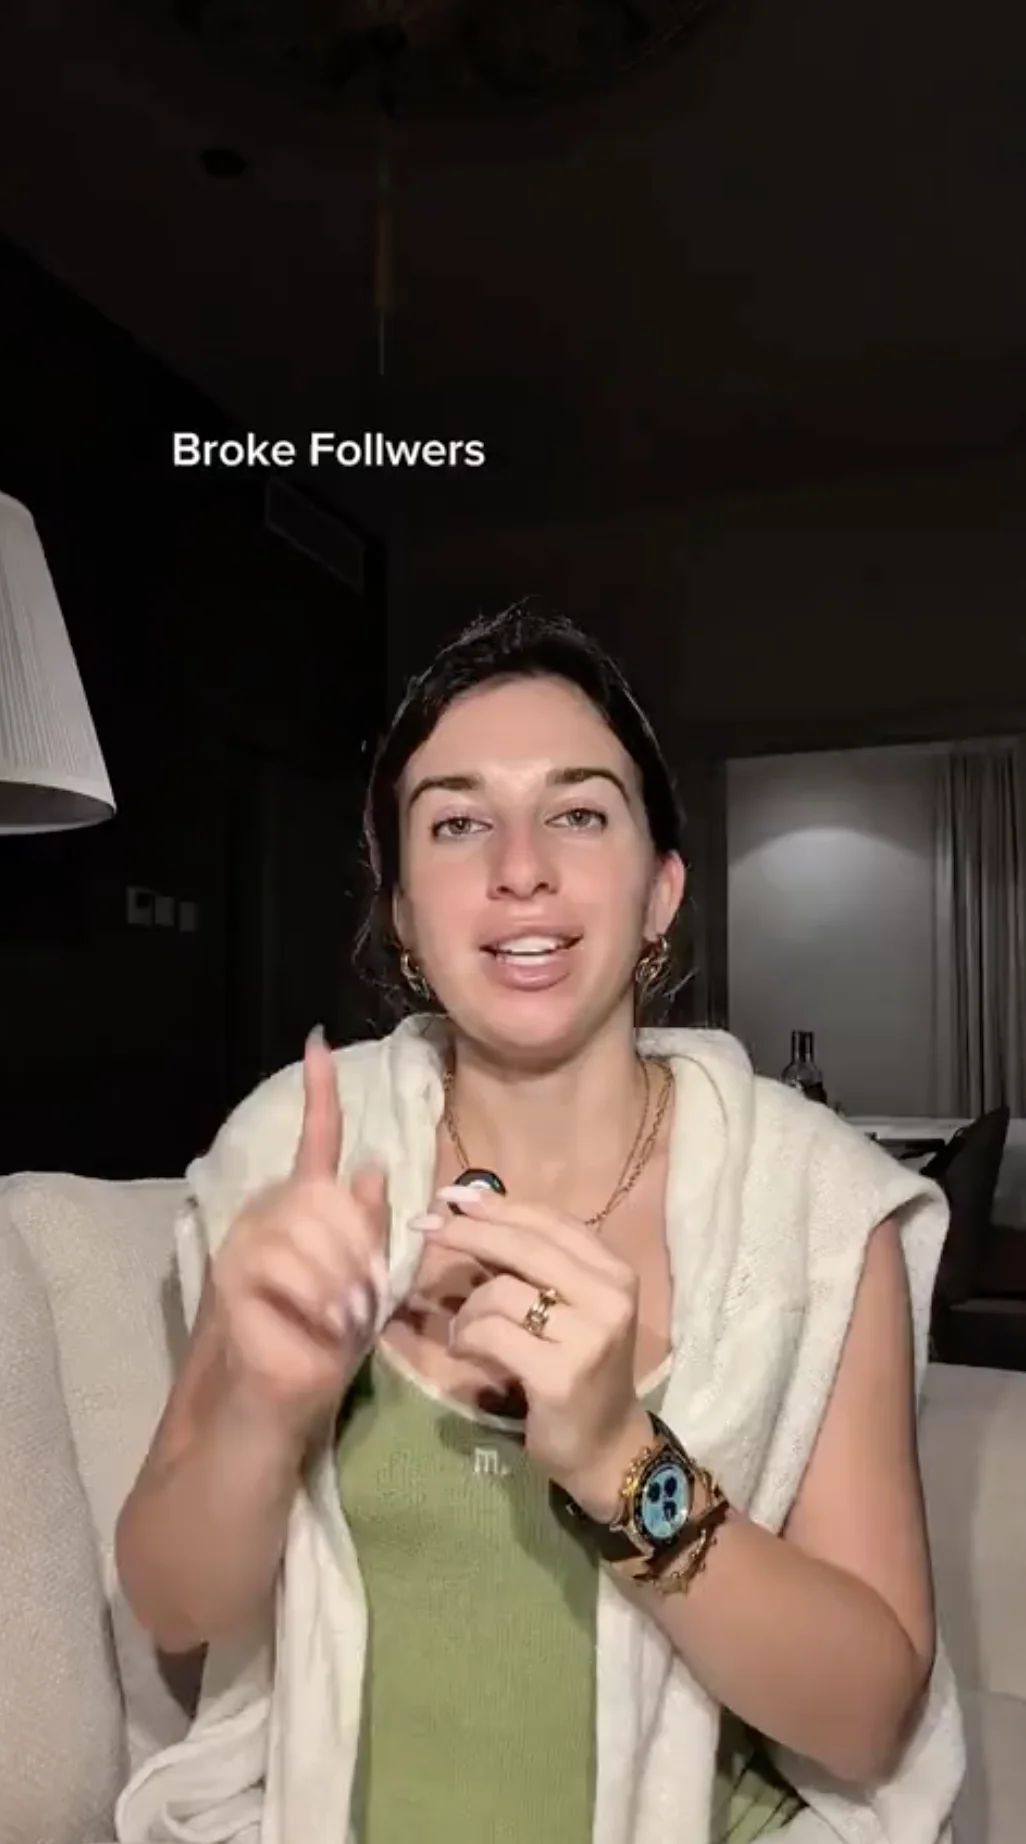
For a couple of weeks my feed kept serving me the same idea in different wrappers: you do not have a followers problem, you have a followers-quality problem. "Broke followers" who like everything and buy nothing, versus an audience that pays. Three different creators, three formats: a rapid 16-second collage piece, a 49-second breakdown with example clips, and a full 81-second mini-essay.
My assumption going in was that the differences between them would be about depth. The longer treatments explain more, so they should hold the committed viewer and lose the casual one; the short one should do the opposite. Standard length trade-off, nothing to test.
Then I ran all three through Jeena with real viewers, and the gaze data drew a different line entirely. It did not separate the videos from each other. It separated something inside each video, the same something, all three times.
The setup
All three videos sell the same reframe: stop optimizing for follower count, start optimizing for follower quality. And all three make the argument with the same two ingredients. Ingredient one: aspiration, the imagery of the life this advice unlocks (lifestyle photos, a beautiful set, city shots). Ingredient two: evidence, the concrete proof (example accounts that did it, the actual method on screen).
Jeena puts each video in front of real viewers who watch on their phones with the front camera on. It captures where their gaze lands frame by frame, when their eyebrows flag a wow moment, and what they report in a short survey afterward. Which means it can score the two ingredients separately: while the creator is making the money claim, is the viewer looking at the vibes or at the proof?
What Jeena saw
The 16-second version
A question hook over a lifestyle collage
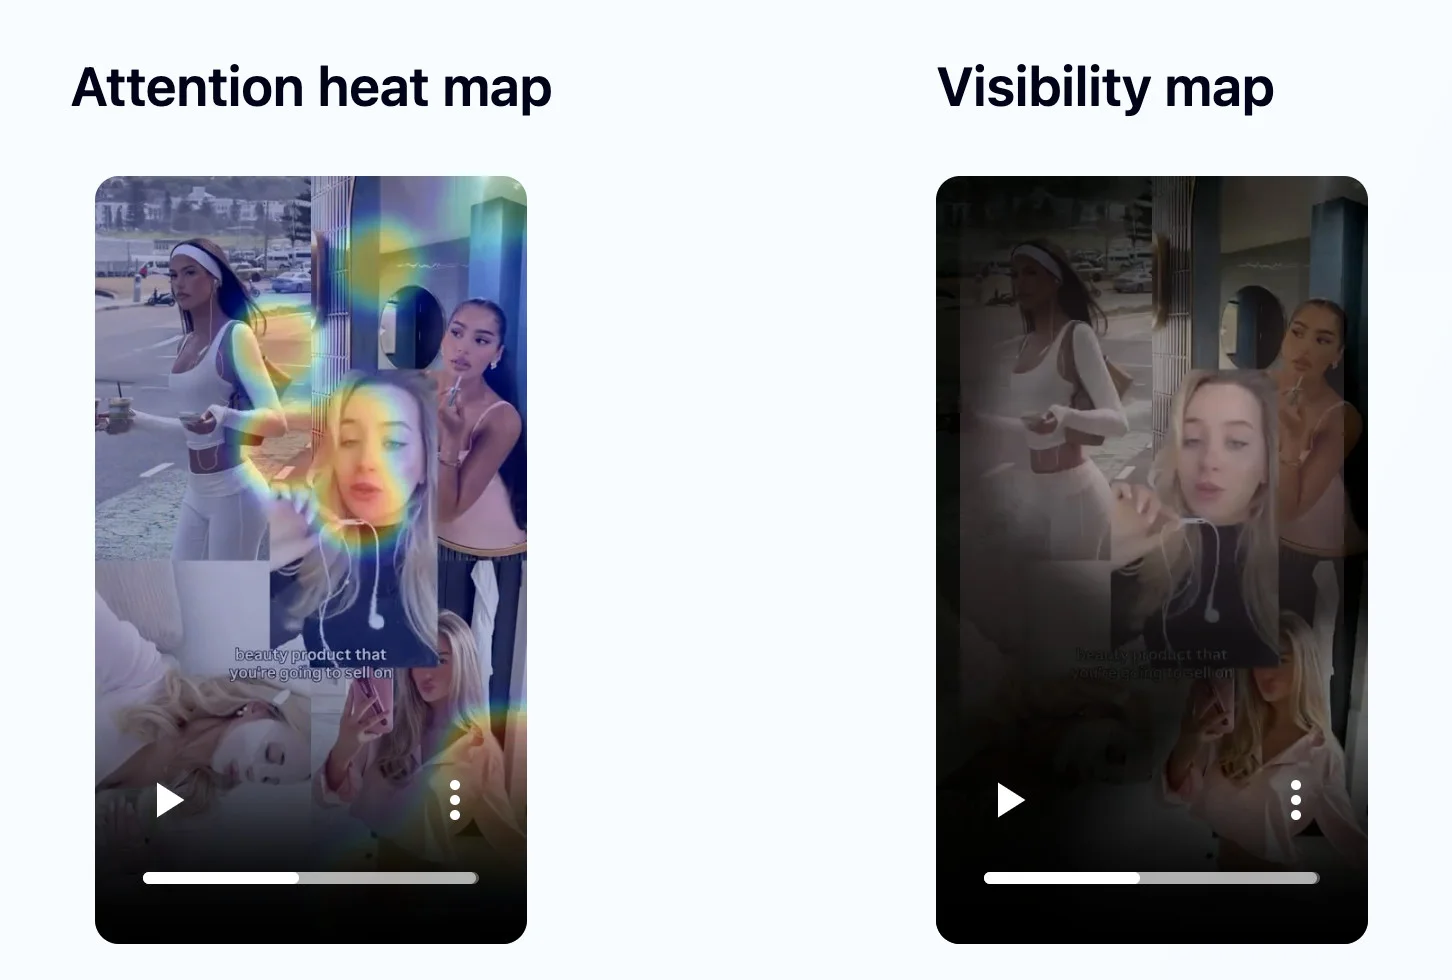
- •The question-led opener wins the frame: 58.1% of on-video gaze on the creator in the first two seconds.
- •Mid-video, the montage splits the eye almost evenly: about 23.9% on the talking head, 23.1% on the background tiles.
- •At 12-16s the busy collage pulls gaze to a mirror-selfie panel, exactly where the "learn and buy" line lands.
- •A large share of gaze leaves the screen early; surveys split between "catchy" and "boring".
The 49-second version
A contrarian thesis with inset examples
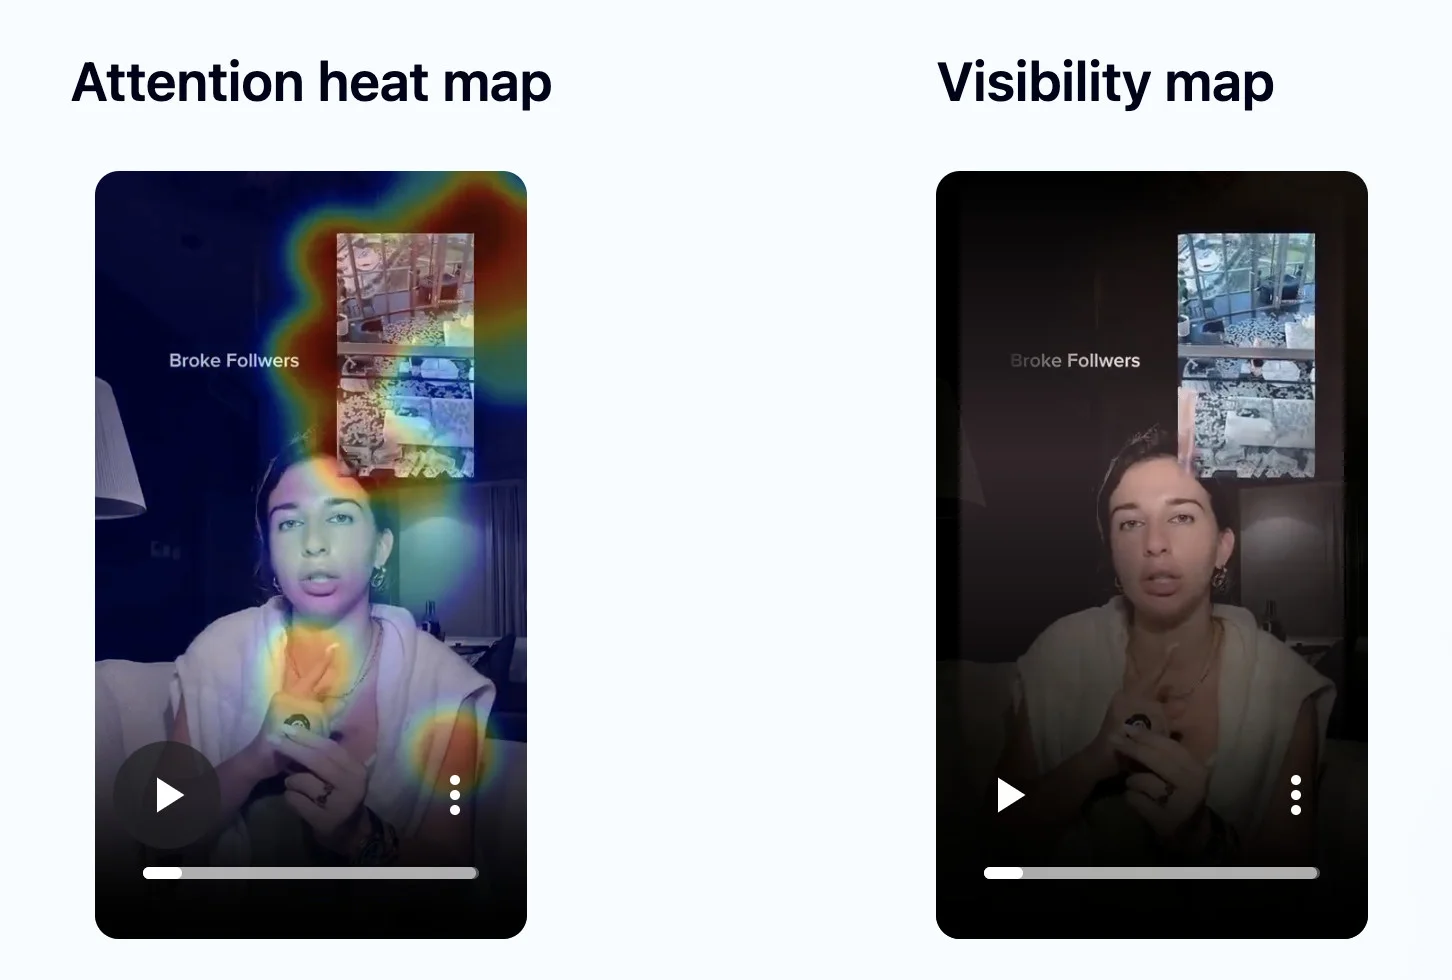
- •The "Broke Followers" opener lands: surveys came back "interesting" (8 of the panel) and "catchy", average 4.0.
- •The strongest hold of the whole video is a piece of proof: the example-account inset captured 40.9% of in-frame gaze.
- •The leak is the set: through 24-48s the window, curtains, and jewelry keep pulling eyes off the speaker.
- •Blink rate climbs above sustained-attention norms as the mid-section wears on.
The 81-second version
A full essay with b-roll and a product payoff
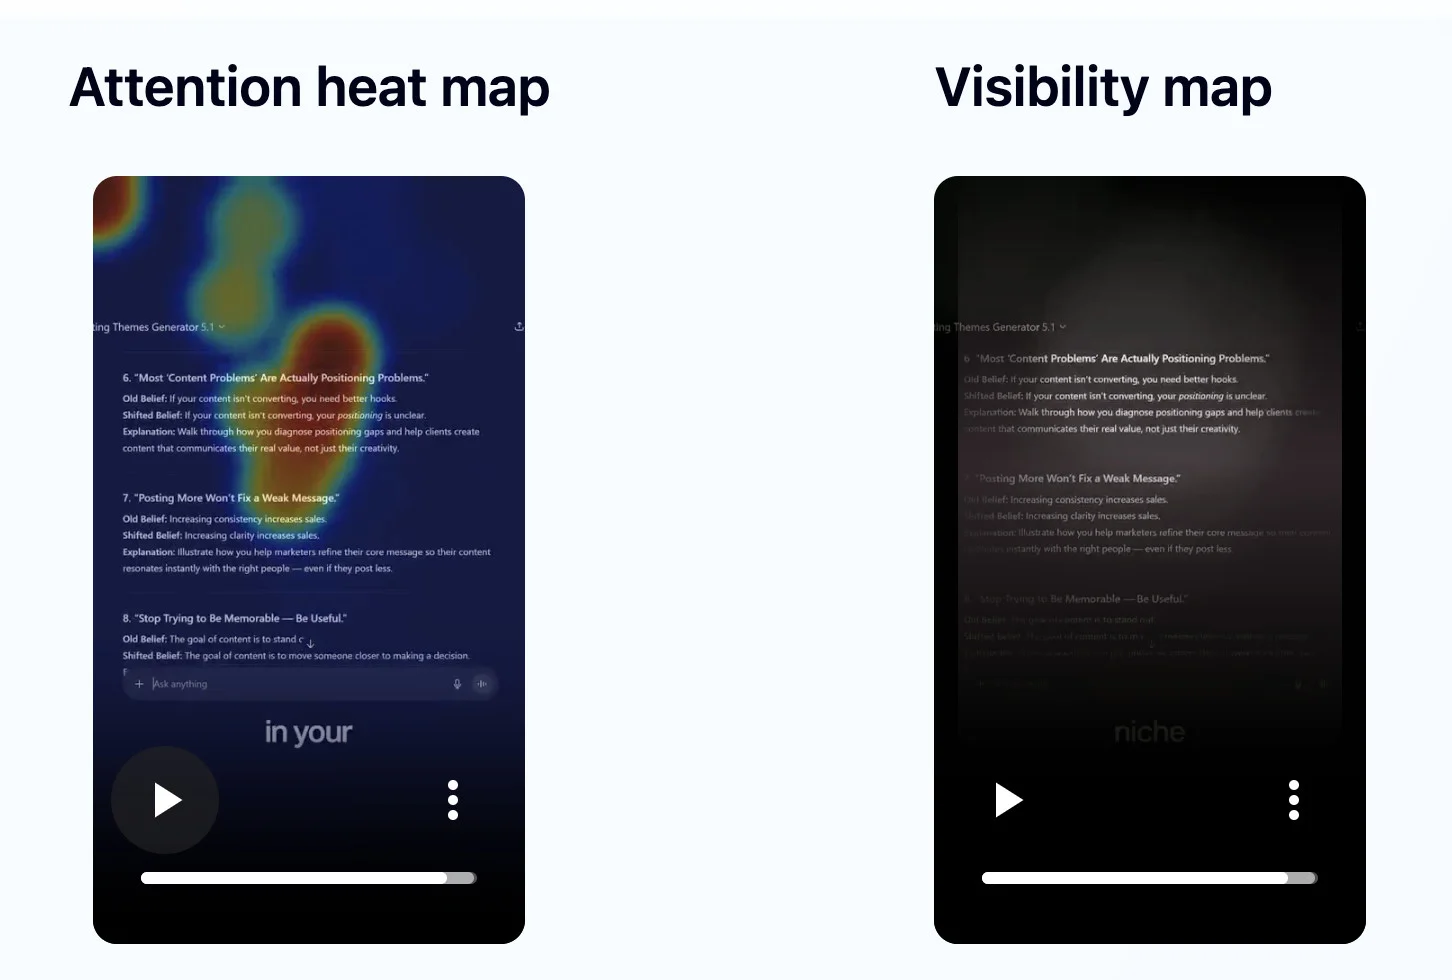
- •The provocative headline holds 41.4% of in-frame attention at the open, with wow spikes to match.
- •The single strongest hold of all three videos is a piece of proof: the product demo at 76-80s captured 56.3% of gaze.
- •The branded concept slide earns 31.2% of gaze and the biggest coordinated wow of the video.
- •The leaks are the vibes: the city-skyline outdoor beat at 48-60s steals the frame, and the long talking stretch at 60-76s slumps.
Three formats, one repeating split
None of these videos is weak. Each opens with a hook the report credits with real measured attention, each landed positive survey responses, and each is polished work by a working strategist.
And in the gaze data, the same line cuts through all three. The moments built on concrete evidence (an example account, the method on screen, the creator herself answering her own question) are the strongest holds each video has. The moments built on aspirational atmosphere (a lifestyle collage, a lived-in set, a city skyline) are where the eyes leave.
What happened in the wild
| The 16s version | The 49s version | The 81s version | |
|---|---|---|---|
| Views | 735.0k | 246.7k | 9.4k |
| Likes | 23.5k | 10.3k | 310 |
| Comments | 220 | 220 | 196 |
| Reposts | 559 | 343 | 9 |
| Duration | 16 seconds | 49 seconds | 81 seconds |
How to read that table honestly
These are the public platform numbers, pulled fresh on the same day (share counts are visible only to a video's owner, so that row cannot exist for someone else's videos). The spread is real: 78x in views from top to bottom. And the lazy explanation for it fails here: the 9.4K-view video belongs to the biggest account of the three, roughly 139K followers, double the 735K-view video's 68K. Audience size predicts the opposite of what happened.
One case is still one case: three videos, different accounts, different posting dates, and comment counts in this genre are often driven by comment-gated lead magnets, so treat the gradient as strong context rather than a controlled experiment. The finding this article stands on is the one measured inside the videos: where the gaze went, claim by claim.
The vibes behaved exactly like the followers in the thesis
Every one of these videos argues the same thing: an audience that looks good but does not pay is a trap. And every one of them decorated itself with imagery that looks good and does not pay: luxury collages, a beautiful set, a city skyline. The eye tracking caught those decorations collecting gaze during the exact claims they were supposed to support, the mirror-selfie panel under the "learn and buy" line, the curtains through the mid-thesis, the skyline under the income claim.
But the proof, the boring-looking concrete evidence, did the opposite. The example-account inset is the 49-second video's strongest hold at 40.9% of gaze. The product demo is the 81-second video's strongest hold at 56.3%, the highest number measured in any of the three. Viewers came for proof and their eyes voted for it.
The genre has the hierarchy backwards. Aspirational atmosphere is treated as the draw and evidence as the homework, but the gaze data says viewers skim the atmosphere and lock onto the evidence. Your audience-quality video is itself an audience-quality test: the vibes attract attention that pays nothing, and the proof attracts the attention that stays.
The vibes worked exactly like broke followers: they showed up, looked good, and paid nothing. The proof got the gaze.
The split, video by video
What held the eye (the proof)
The creator herself, answering her own question hook: 58.1% of on-video gaze in the opener.
The example-account inset, the video's single strongest hold at 40.9% of in-frame gaze.
The product demo at 76-80s (56.3% of gaze) and the branded concept slide (31.2%, biggest wow).
In every video, the strongest gaze magnet is concrete evidence: a person answering, an account that did it, the method on screen. Not one of the three peaks happens on atmosphere.
What leaked it (the vibes)
The lifestyle collage: tiles split the eye evenly with the speaker mid-video, and the mirror-selfie panel pulls gaze at the close.
The set: window, curtains, and jewelry pull eyes off the speaker through 24-48s, with blink rate climbing.
The city-skyline outdoor beat at 48-60s and the long uninterrupted talking stretch at 60-76s.
The leaks concentrate on the frames where the core promise is spoken. The seconds each video most needed were the seconds its own decoration was stealing.
What the reports prescribe
Swap the busiest collage beat for a full-frame close-up, center the key caption, and replay the opening question as a loop ending.
A subtle 2-4% zoom crop to push the set out of frame during the slumps, plus micro-interrupts synced to the speaker's beats.
Tighten the outdoor framing so the skyline stops competing, break the talking stretch every 2-3 seconds, and close on the opening headline.
Three different videos, one converging prescription: mute the atmosphere, keep the proof on screen, and loop the ending back to the hook.
Three transferable principles for authority content
Spend your seconds on proof, not atmosphere
The highest-gaze moments in all three videos were concrete evidence: an example account at 40.9%, a product demo at 56.3%. The aspirational imagery the genre treats as mandatory is where the eyes left. If a frame exists to prove the dream rather than the method, it is probably leaking.
During a claim, let nothing decorative share the frame
The leaks in this case cluster on the money lines: a mirror-selfie panel under "learn and buy", curtains through the mid-thesis, a skyline under the income claim. The fixes are cheap (a crop, a blur, a full-frame close-up), but they only get applied when you know which claim is being robbed.
End on the hook, not on a vibe
All three reports converge on the same close: replay the opening hook as the final beat so the video loops. The 81-second version shows why the order matters: its best asset (the 56.3% product demo) sits at the very end, after a leaking outdoor beat and a slumping talking stretch that most viewers never crossed.
What this means if you make these videos
If you make authority content, the trap is built into the genre itself. The topic demands proof of success, proof of success photographs beautifully, and beautiful imagery steals gaze from the claims it decorates. None of the three creators here did anything unusual. They did what the genre teaches, and the eye tracking billed them for it, while quietly revealing that their least glamorous material, the plain proof, was the strongest thing they had.
The fix costs nothing at filming time: mute the decor during the claims, give the evidence the full frame, and spend your final seconds looping the hook instead of setting a mood. What it requires is knowing which seconds are leaking, and that is not visible from the outside. I keep finding the same physics in other niches: a background stealing an outfit reveal, a lab coat out-pulling a dermatologist's face, scenery eating a tutorial. The props change. The physics do not.
Find out what competes with your claims
You can run this exact analysis on your own video. Upload it to Jeena. Real viewers watch it on their phones, with the front camera on, and share their impressions in a short survey. Jeena maps where their eyes went, when they raised their eyebrows, and which moments lost them. You get an attention heatmap, a visibility map, a wow-moments chart, a summary of how viewers perceived the video, and three concrete recommendations.
No "schedule a call." No sales rep. Upload, get your report.
Frequently asked
What pulled attention away in all three videos?+
The aspirational decoration each creator added to set the mood: the lifestyle collage (including a mirror-selfie panel under the "learn and buy" line) in the 16-second version, the window, curtains, and jewelry of the set in the 49-second version, and the city-skyline outdoor beat in the 81-second version. In each case the leak concentrated on the frames where the core money claim was being made. The concrete evidence, by contrast, held: an example-account inset captured 40.9% of gaze and a product demo 56.3%, each the strongest moment of its video.
Should you use luxury b-roll and lifestyle imagery in personal-brand videos?+
Treat it as seasoning, never as the base, and keep it away from your key claims. In this case the gaze data ranked every video's moments the same way: concrete proof (example accounts, the method on screen) held the eye best, while aspirational atmosphere leaked it, precisely during the promises it was meant to support. When a claim is on screen, mute the decor with a crop, a blur, or a full-frame close-up, and show the evidence full-frame in sequence rather than as a small parallel inset.
What is Jeena?+
Jeena is a neuromarketing platform for short-form video. Real people watch your video on their phone with the front camera on. Jeena captures their gaze direction, blink rate, eyebrow raises, and their impressions of the video in a short survey afterward. You receive an AI-powered report with an attention heatmap, a visibility map, a wow-moments chart, a summary of how viewers perceived the video, and three specific recommendations for making the video work harder.
How does Jeena measure viewer attention?+
Jeena uses smartphone front-camera gaze tracking. Each engager calibrates once, then watches your video. The platform records where their gaze lands frame by frame, flags moments of surprise from facial expression, and combines that with a short impressions survey afterward. The result is a per-second timeline of what real viewers actually looked at and felt, plus a summary of how they perceived the video overall.
Can I test my own video on Jeena?+
Yes. Sign up, upload your video, set a goal (Views, Sales, Pitch, Followers, and so on), and Jeena runs the test with its panel of engagers. The report typically arrives within a day, with an attention heatmap, a visibility map, a wow-moments chart, and three concrete creative recommendations.
How much does it cost?+
A typical test costs around ten euros. See the pricing page for current rates.